
A Texas 2036 Live Guide
Your Guide to Texas A-F School Ratings
The latest results, Texas 2036 analysis and clear explanations of how the rating system works.
The Texas Education Agency (TEA) released its latest A-F accountability ratings on Aug. 14. The ratings provide an updated view of academic performance across Texas public school districts and campuses.
Last updated: August 14, 2026

Latest Results
2026 A-F Ratings Results
The 2026 results show where student outcomes are improving statewide, where challenges remain and which schools are posting strong results despite real barriers.
Data Source
Texas Education Agency
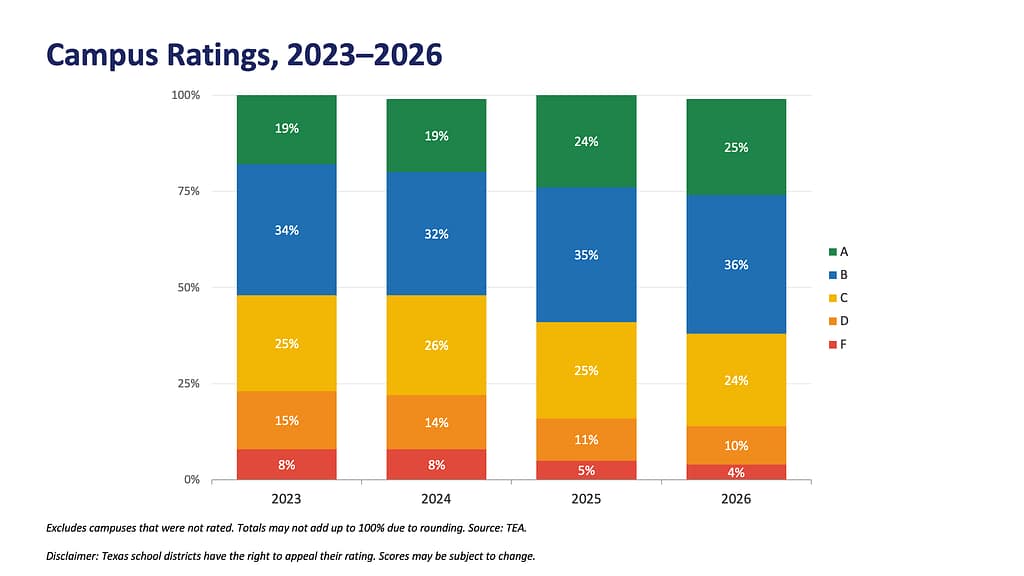
- The share of “A” and “B” campuses grew from 59% to 61% (+2 percentage points).
- 24% of campuses improved their rating from the prior year.
- 49% of campuses with 80%+ economically disadvantaged students earned an A or B in 2026, up from 47% the year before.
- Overall, 396 campuses with 80%+ economically disadvantaged students earned an A in 2026.
- 585 Campuses moved from below an A in 2025 to A in 2026.
Disclaimer: Texas school districts have the right to appeal their rating by Dec. 2026. Scores may be subject to change.
Why Ratings Matter
A rating is a tool to help parents and community members understand how students are doing on a particular campus.
The results can help families ask informed questions, help school leaders identify areas for improvement and help state policymakers see where additional attention or support may be needed.
Understanding the Ratings
How Texas Schools Receive an A-F Rating
Texas considers what students have learned, how much progress they have made and whether schools are improving outcomes for every student group.
01
Student Achievement
This domain measures what students know and can do at the end of the school year. Depending on the type of campus or district, it may include STAAR performance, graduation rates and indicators of college, career or military readiness.
02
School Progress
This domain examines how much students have improved academically and how a school’s performance compares with that of schools serving similar student populations.
03
Closing the Gaps
This domain measures performance across different student groups. It helps show whether schools are making progress toward ensuring that all students have opportunities to succeed.
From performance to a letter grade
The TEA uses results across these domains to calculate an overall score and assign an A–F rating. An A reflects exemplary performance, while an F indicates that significant improvement is needed.
Ratings are most useful when viewed alongside underlying scores, student-group outcomes and how the school performs relative to its peers.
A
B
C
D
F
Explore the Data
A-F Ratings Across Texas
Explore the latest accountability ratings to see how public school districts and campuses performed. Search for a specific school or district to compare results across Texas.
School Performance Examples
What School Performance Looks Like Across Texas
The underlying data tell a more complete story. Explore examples of what different ratings reveal about achievement, progress and student opportunity.
Myth vs. Fact
What Texas A-F Ratings Do and Don’t Tell Us
Texas 2036 examines common claims about the accountability system and explains what the ratings can and cannot tell families, educators and policymakers.
An Evolving Texas Guide
Follow the Latest A-F Ratings and Analysis
Texas 2036 will update this guide as new accountability data, analysis and resources become available.
Receive the latest insights on Texas schools, student outcomes and the policies shaping public education.