

HOTTER DAYS AHEAD
A TREND TOWARD LONGER WILDFIRE SEASONS

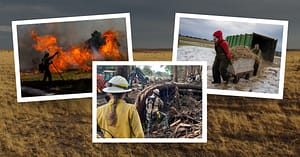
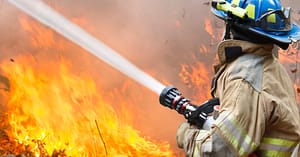
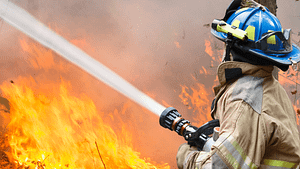
Firefighters battle flames from the reignited Smokehouse Creek fire. (Texas A&M AgriLife photo by Sam Craft)
Texas faces an increased number of days with high wildfire risk, especially in the western and southern portions of the state. The Smokehouse Creek fire in late February — the largest Texas wildfire on record — is a dramatic reminder of the state’s susceptibility to this destructive extreme weather event.
While data suggests western and southern Texas already faces an increased risk of wildfire, increased dryness statewide may expand the threat eastward, as increased temperatures will cause very dry conditions to develop earlier in the year, lengthening both the spring and summer wildfire seasons.
MORE INTENSE SEVERE WEATHER
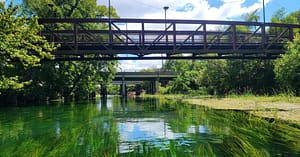
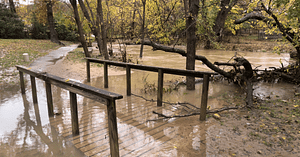
A 5-15% increase in extreme one-day precipitation events since the late 20th century will contribute to greater urban flooding by 2036.
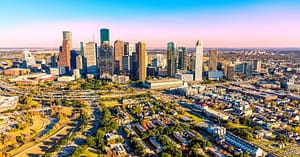
The frequency of flooding incidents in urban areas is expected to double compared to historical records, pressing the need for substantial investments in flood infrastructure and planning. Some areas, like the Lower Rio Grande Valley and the Gulf Coast, are expected to see significant increases in rainfall, contributing to heightened flood risks.

A man watches Hurricane Hanna approach downtown Corpus Christi’s shores in July 2020. (Meagan Falcon/Caller-Times)
EXTREME WEATHER’S IMPACT ON TEXANS

87%
of Texas voters expressed concern that weather-related events in Texas such as wildfires, floods, drought and hurricanes may increase what they pay for property insurance. (Texas Voter Poll, Aug. 2023)

78%
of Texas voters think that the weather has changed over the past 10 years. (Texas Voter Poll, Aug. 2023)