
Concentration, competition and cost: How are the hospital markets of Texas?
One of Texas 2036’s goals is measuring the system affordability of health and health care, to help ensure prices do not create a barrier to individuals getting the care they need when they need it. To measure progress toward this, Goal No. 9 in our Strategic Framework uses data on the level of hospital market concentration in metro areas. The Health Care Cost Institute calculates a hospital market concentration index by Core Based Statistical Areas, using the Herfindahl-Hirschman Index.
Components of concentration calculation
A Core Based Statistical Area is a U.S. geographic area defined as one or more counties, or equivalents, anchored by an urban center of 10,000 people or more. The area also includes adjacent counties that are socioeconomically tied to the urban nucleus by commuting.
The Herfindahl–Hirschman Index is a commonly accepted measure of market concentration. It is calculated by squaring the market share of each entity competing in the market and then summing the resulting numbers. This measure ranges from 0 to 10,000, where 0 represents perfect competition and 10,000 represents a monopoly.
A higher Herfindahl-Hirschman Index value signifies a more highly concentrated market — that is, within a market, a smaller number of hospital systems account for a larger share of hospital admissions. The index value increases when both the number of systems in the market decreases and as the disparity in size between those systems increases.
National outlook
The share of hospital admissions, within a metro area, depends on if local patients seek care within their metro area or, for varied reasons including preference and pricing, choose hospitals in neighboring locales.
The tracking of such market concentration is valuable as there is strong evidence that hospital market consolidation leads to higher prices:
- COVID-19, Market Consolidation, And Price Growth – Health Affairs Forefront
- What We Know About Provider Consolidation – KFF
- The Impact of Hospital Consolidation on Medical Costs – NCCI
- Hospital Consolidation Continues to Boost Costs, Narrow Access, and Impact Care Quality – Penn LDI
- Policy Solutions for Hospital Consolidation – American Enterprise Institute
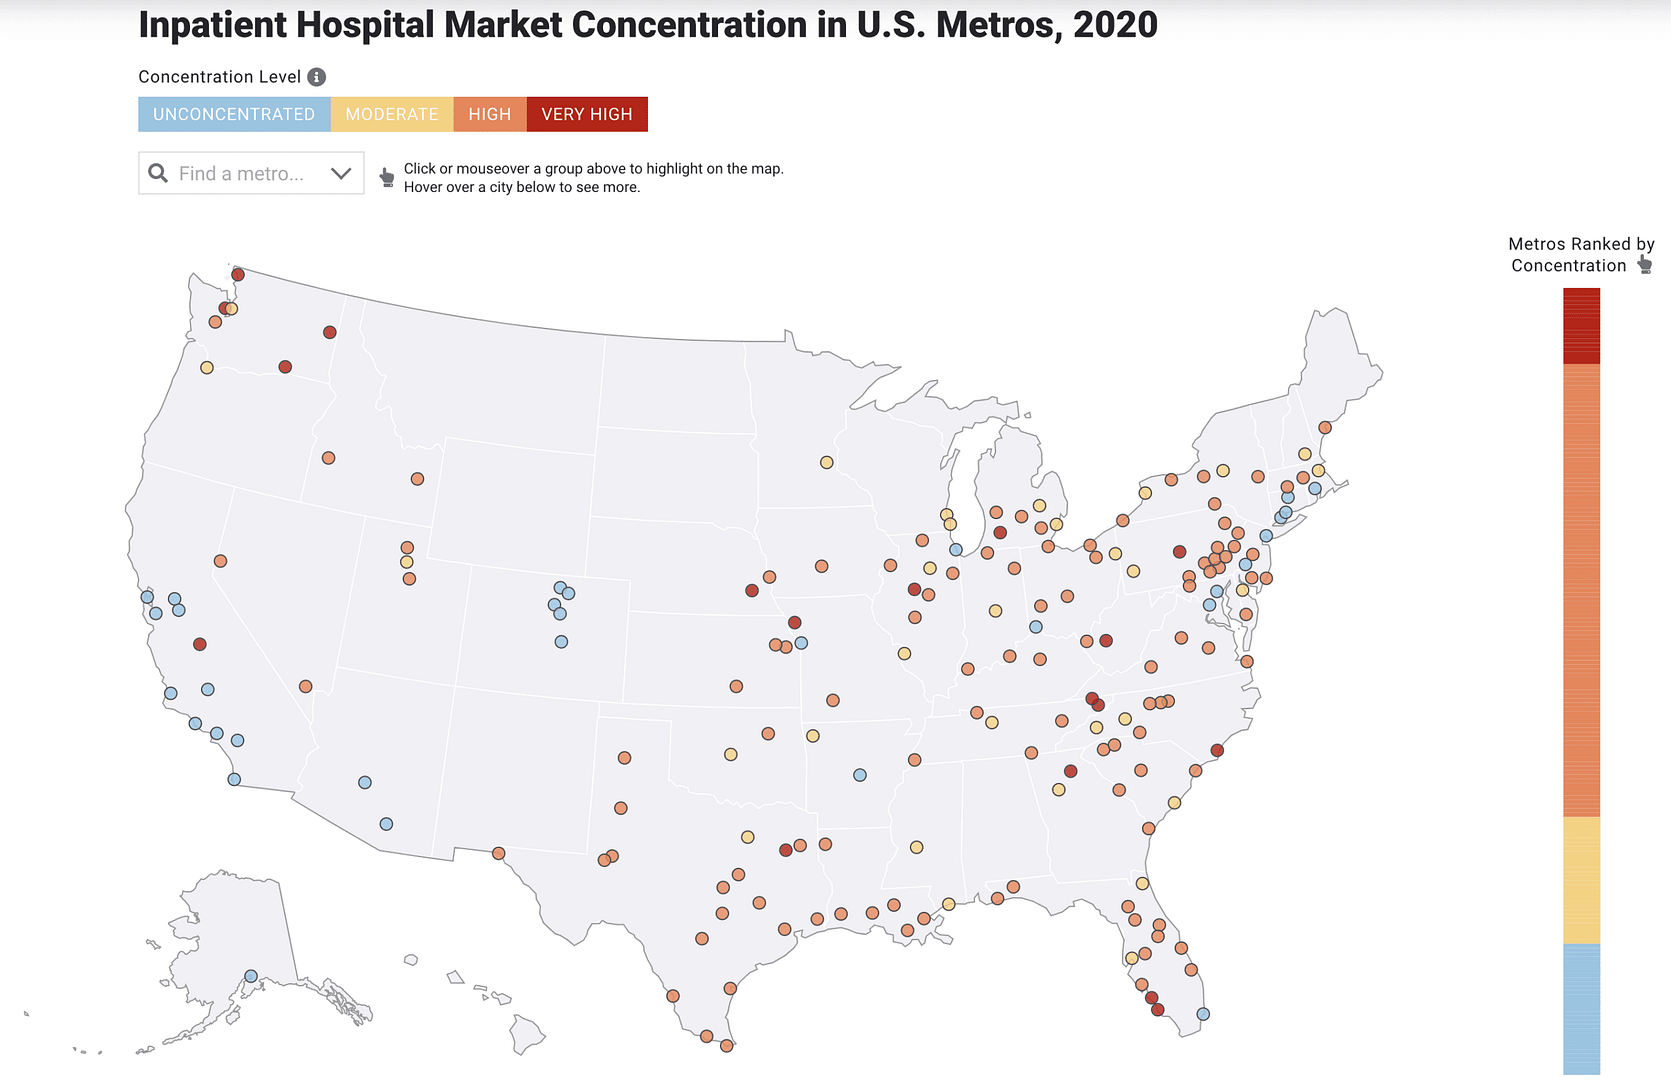
The map below provides a view of market concentration across the nation. In 2016, 62% of all U.S. metro areas analyzed were considered highly or very highly concentrated. That national percentage rose to 67% by 2020.
Concentration in Texas markets
As across the nation, Texas’ metro areas are increasingly becoming concentrated in regards to hospital markets. In fact, a maximum of only two Texan metro areas were rated as moderately concentrated while all others were highly or very highly concentrated from 2016 to 2020. The chart below displays the 19 Texan metro areas tracked by the Health Care Cost Institute categorized by hospital market concentration during that period.
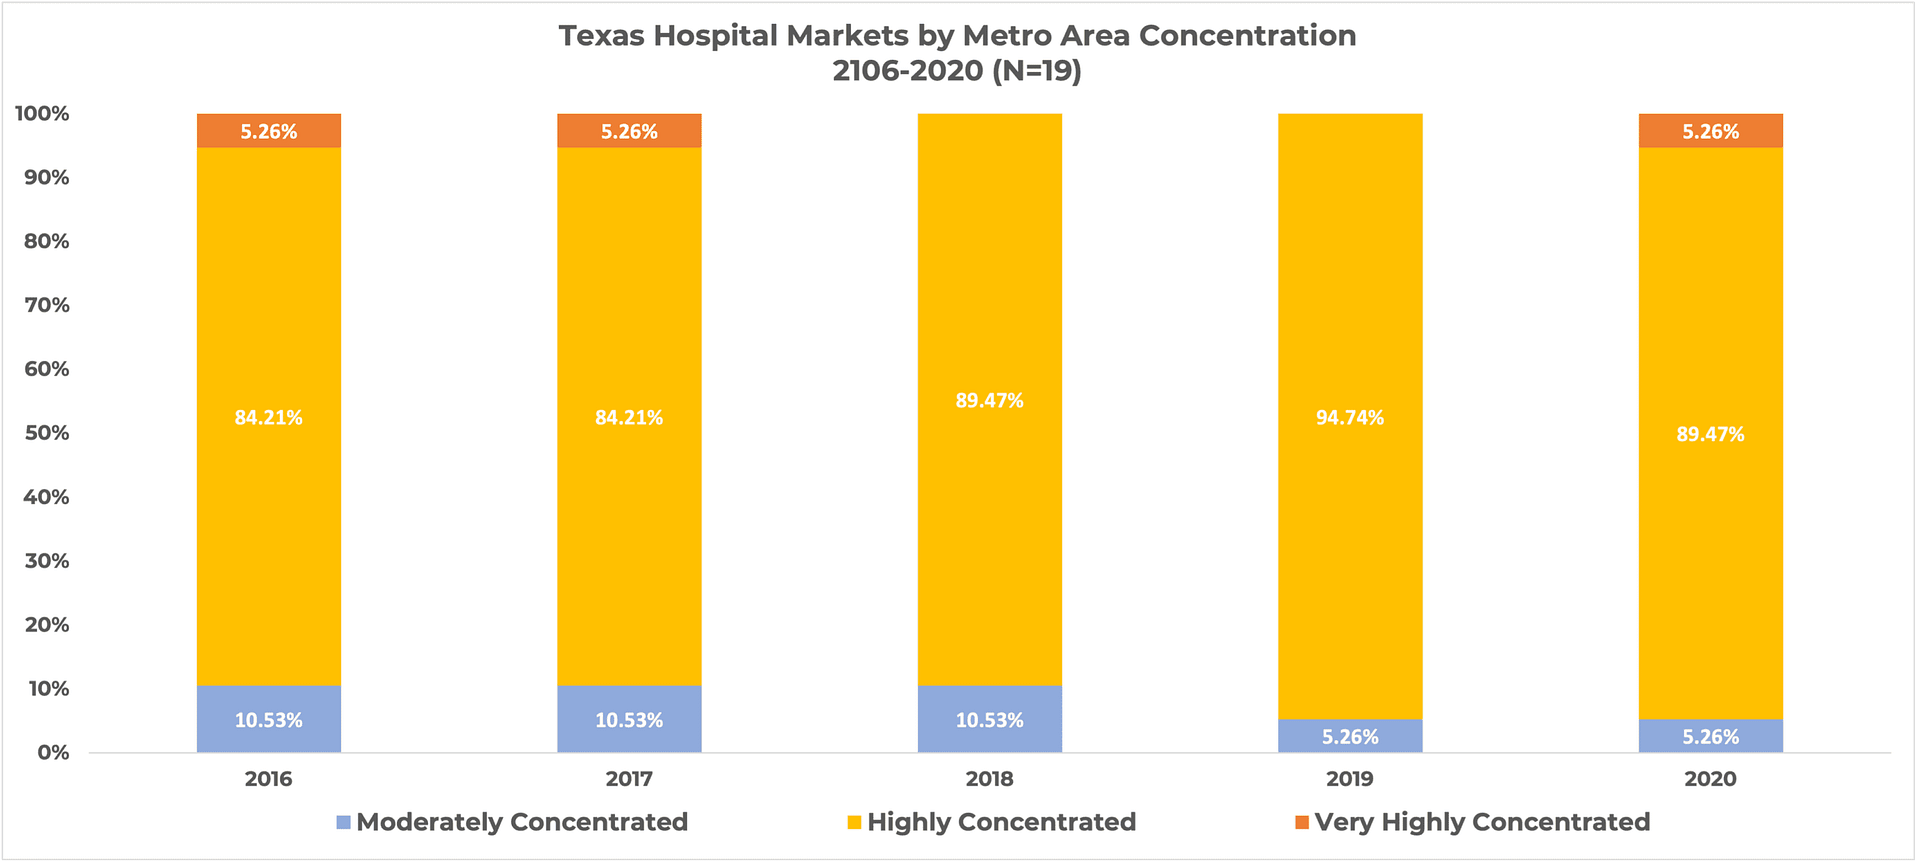 From 2016 to 2018, 90% of the 19 Texas metro areas fell into the highly and very highly concentrated level. Since 2019 the percentage has increased to 95%.
Population living in concentrations classified as high or very high
To compare Texas nationally and across time, Texas 2036 assigned Core Based Statistical Areas to their primary state. As these metro areas cross state lines, each has been assigned to the state containing the largest population share — the primary state. Using Core Based Statistical Areas and state U.S. Census population figures, a metric was created to represent the percentage of a state’s population residing in Core Based Statistical Areas that have been given a hospital market index of highly or very highly concentrated.
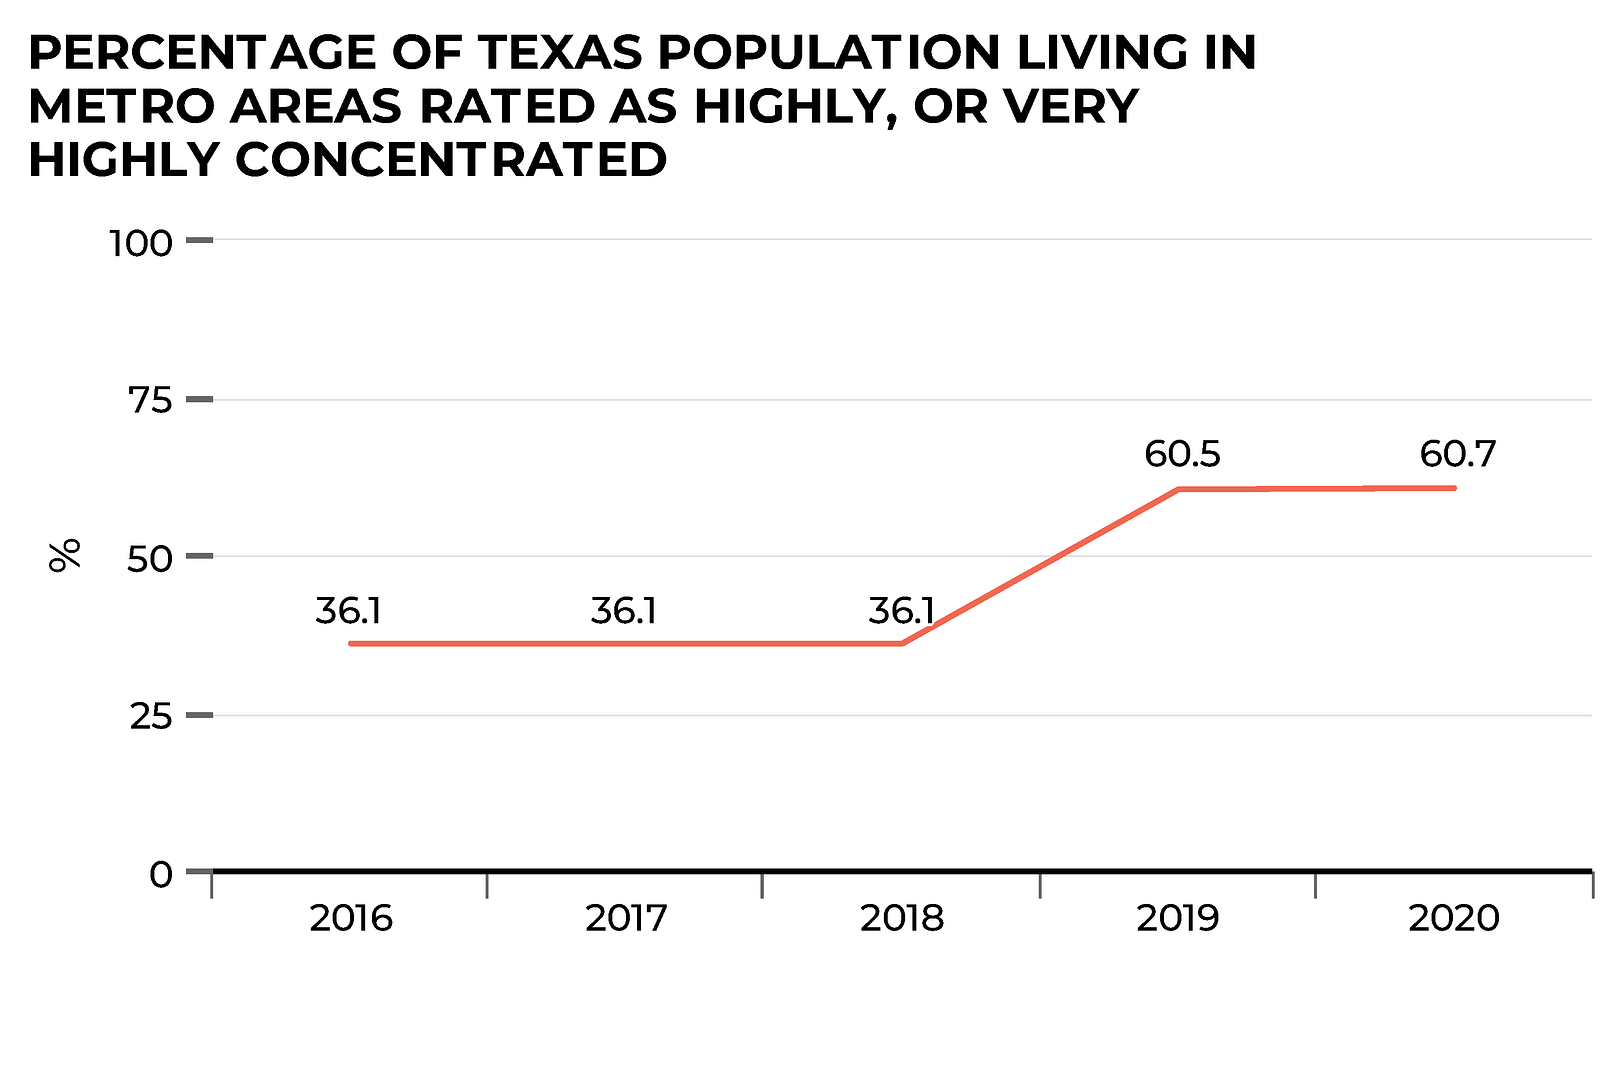
At 61%, the percentage of Texas’ Core Based Statistical Areas populace living in highly or very highly concentrated markets, based on the primary state assignment, is at a five-year high as displayed in the graph below.
To estimate how Texas compares to its 12 peer states, the assignment of Core Based Statistical Areas to primary states was replicated. Texas has a larger percentage of its Core Based Statistical Areas population in highly or very highly hospital markets than any peer state.
| State | 2020 Hospital Market Concentration
(% of state population living in “highly” or “very highly concentrated” metro areas) |
| Texas | 60.68 |
| Ohio | 54.17 |
| North Carolina | 43.81 |
| Virginia | 42.31 |
| Florida | 40.20 |
| Pennsylvania | 34.62 |
| Washington | 21.90 |
| New York | 14.36 |
| Georgia | 11.38 |
| Illinois | 9.59 |
| California | 2.55 |
| Colorado | 0.00 |
Policymakers interested in addressing high prices for Texas health care could consider policies to:
- Limit opportunities for further market concentration;
- Reduce existing concentration of markets; and/or,
- Mitigate the harmful impacts that existing concentration has on prices.
By addressing one of the underlying causes of high health care prices, Texas could make major improvements in the availability of affordable care.