TX’s labor market and the price of recovery: Strategic Framework
This analysis of Texas’ labor market is part of our blog series for Texas 2036’s Strategic Framework, which provides in-depth, cross-cutting data to inform key decisions about the most significant issues facing the state.
As the state recovers from the effects of the COVID-19 pandemic and public health policies that were adopted in response, Texas’ labor market is the tightest it has been in the last decade, with more job openings than people unemployed statewide.
This is a topic we can explore through data from Texas 2036’s Strategic Framework Goal No. 6: Texans meet the state’s current and future workforce needs.
The Texas unemployment rate peaked at 12.6% in April 2020 before falling to 4% in September 2022. Returning to pre-pandemic levels of unemployment after a sharp uptick in jobless rates has been costly, literally.
Figure 1
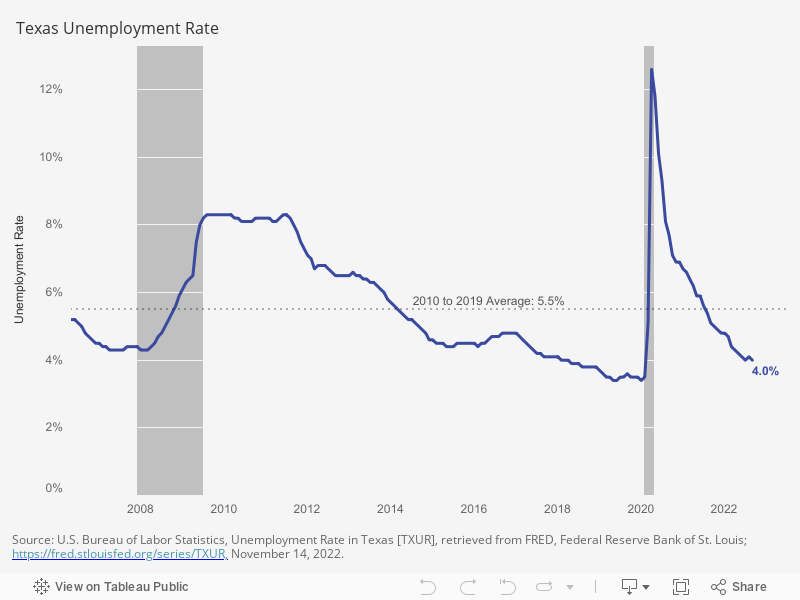
Typically, periods of higher unemployment rates are the effect of recessions, depicted in the graph above as the gray shaded areas. The initial spike in unemployment in 2020 was caused by public health measures – lockdowns and shelter-in-home orders – and reduced spending around the world. This was met with monetary and fiscal interventions from central banks and governments under the Keynesian belief that governments should cut spending in times of economic booms and promote spending at times of recession.
The U.S. recession caused by the COVID-19 pandemic was the shortest recorded in history, but it triggered record fiscal stimulus packages and monetary policy with the aim of bringing unemployment back to normal levels. As consumers were encouraged to spend more, global supply chains suffered a shortage in transportation workers, trade port congestions and logistical backlogs due to the COVID-19 pandemic. As stimulus packages “kicked in,” people returned to work and consumption spiked at a time when supply for goods was hindered.
Recovery has been costly.
Figure 2
With a stalled supply chain and tightening labor markets, pressure on inflation persists. Texas 2036’s Strategic Framework envisions a state where all Texans have the opportunity to attain a middle-class life. Some of the Framework’s state-level cost of living indicators depict individual inflationary burdens worsening since the Great Recession.
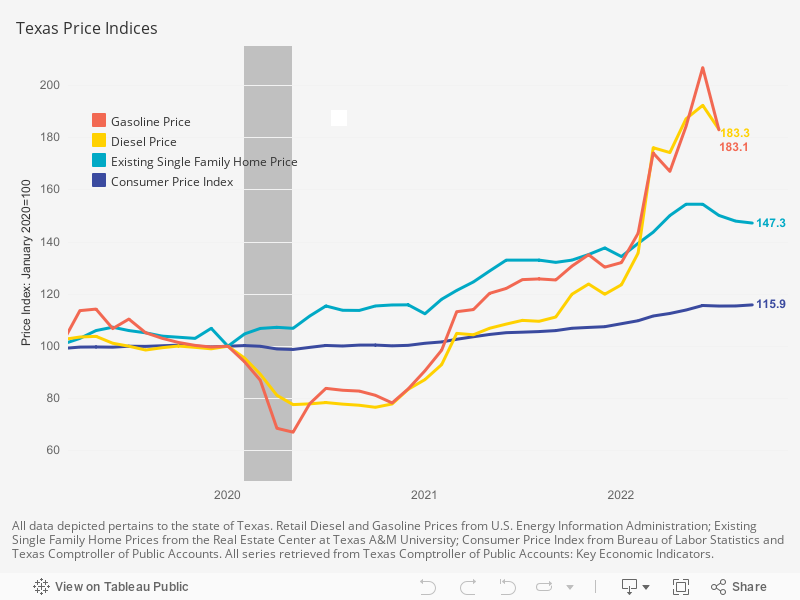
To illustrate the magnitude of recent inflation in Texas, Figure 2 depicts four state-level price indices rebased to January 2020. The rebased Consumer Price Index increased to 115.9 in September 2022 and can be interpreted as a 15.9% rise in the price of goods and services in Texas in just 20 months. The price of existing single family homes in Texas rose 47.3% from its level at the start of 2020. Due to lockdowns and an initial reduction in consumer spending, retail fuel prices saw a decline at the start of 2020. However, this was followed by a sharp increase in diesel and gasoline prices to 83% higher than its level in January 2020. As the economy continues to stabilize and labor markets continue to tighten, the price of everything ticks up and wages struggle to keep up. The Inflation Reduction Act aims to keep the rise of prices under control, but literature suggests the Act will have minimal impact on inflation.
Figure 3
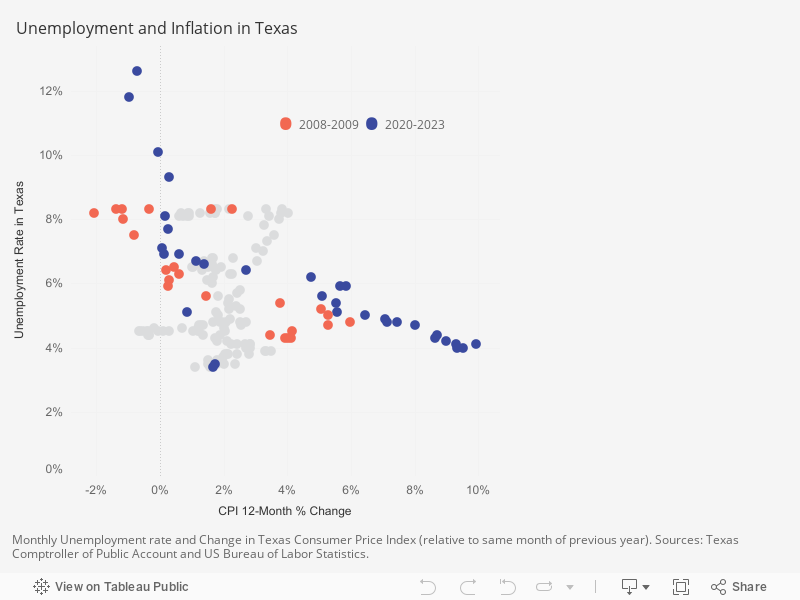
Figure 3 displays the monthly Texas unemployment rate and inflation from January 2008 to September 2022. Monthly observations in years of economic downturn and recovery are displayed as orange for the Great Recession and blue for the COVID-19 pandemic. As mentioned, the unemployment rate spiked to a historic high of 12.6% in April 2020. Subsequent months depicted a steady decrease in the unemployment rate accompanied by an increase in prices — see Phillips Curve. June 2022 recorded the highest yearly change in consumer prices at 9.9%. The most current available datapoint, for September 2022, depicted an unemployment rate of 4% with an inflation rate of 9.3%, showing signs of an ending recovery cycle as inflation begins to recede.