

Yesterday, the Texas Education Agency released this year’s STAAR exam results, giving us the most up-to-date data on how students are performing across the state and how far we have come in terms of COVID recovery.
As with all data, there are a lot of ways to cut it and even more ways to analyze it. When policymakers, school leaders and families look at these scores, they must look at passage rate, the percent of students on grade level, how our top performers are doing, and how we are doing relative to prior to the pandemic, and that’s just the start of it.
Below, we break this all down.
Overall Performance:
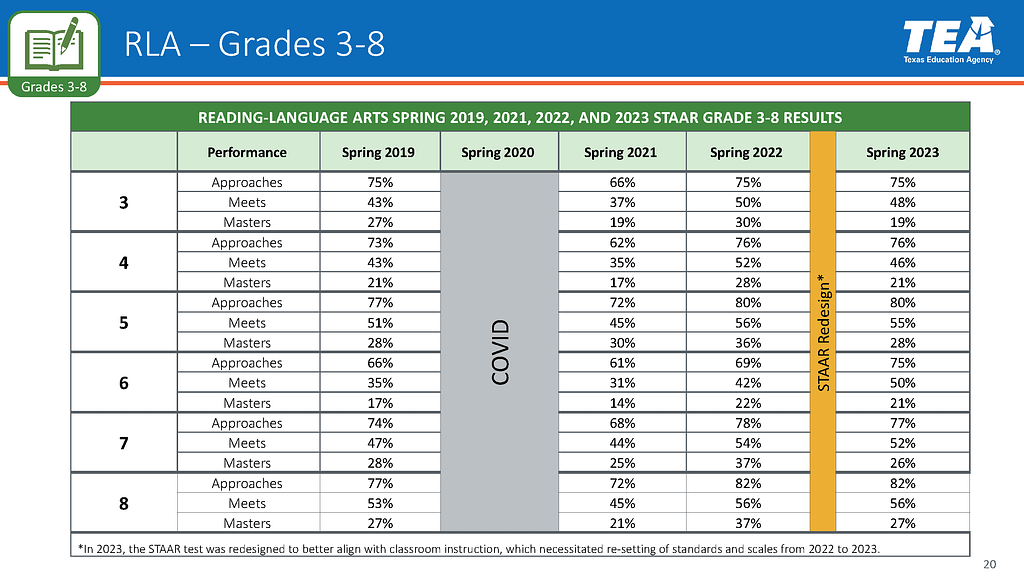
- Reading performance remained stable year-over-year, with 52% of students on grade level. Overall, more students are reading at grade level than before the pandemic. This improvement is diminished by year-over-year declines in mastery across all grades.
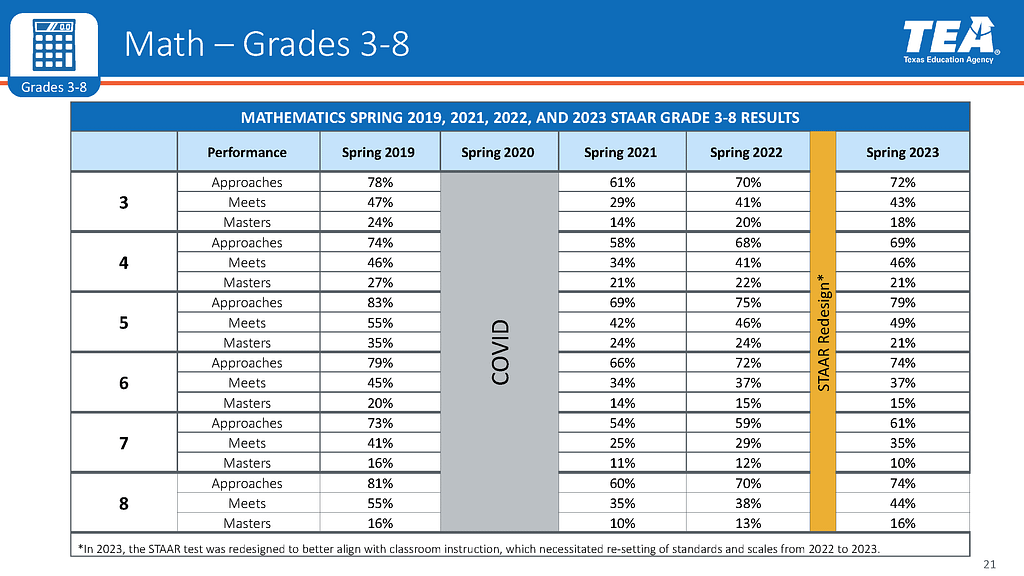
- Math performance improved year-over-year, with the percentage of students on grade level increasing by 3 percentage points. Despite this improvement, these scores are still 7 percentage points below pre-pandemic levels for “Meets” and 8 percentage points below pre-pandemic levels for “Masters.”
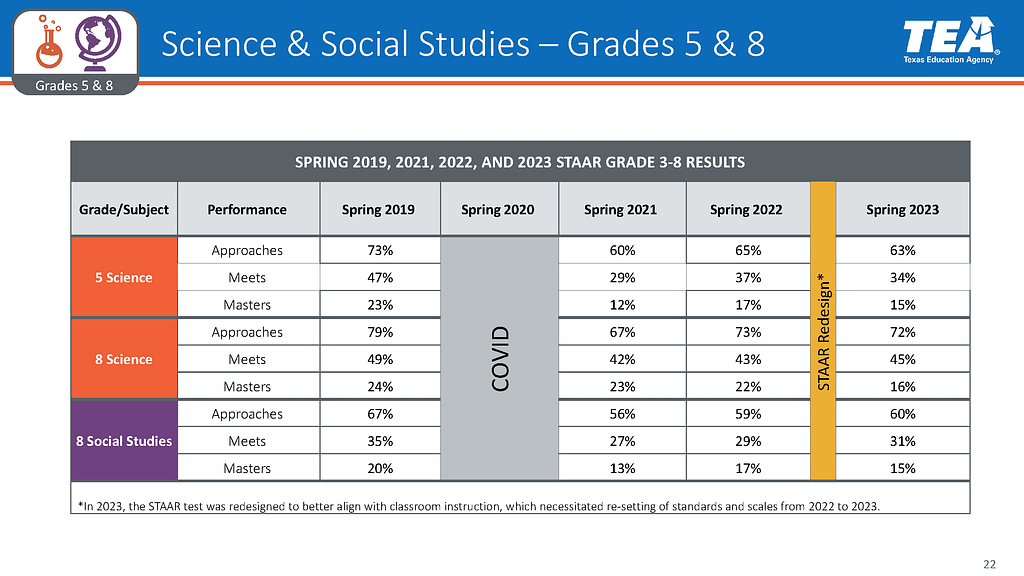
- Science passage rates increased slightly by 1 percentage point while grade level proficiency (at or above Meets) remained unchanged from last year at 46%. The percent of students demonstrating “Masters” level proficiency dropped by 3 percentage points.
- Social Studies passage rates across all grades increased by 4 points while grade level performance increased by 1 percentage point to 50%; however, social studies is only tested twice, once in 8th grade and once in high school on the U.S. History End-of-Course Exam. The reality is that only 31% of 8th graders scored at or above “Meets,” compared to the 71% of students who scored at or above “Meets” on the U.S. History EOC. This means that student performance on high school history is significantly higher than in 8th grade social studies.
Reading Performance:
Across All Grades, More Students Are Reading At Grade Level Than Before The Pandemic: Compared to a 2019 baseline, student proficiency rates in grades 3-8 exceeded pre-pandemic levels but the percent of students on grade level for 3-8 dropped by 1 percentage point. The most dramatic increase is in 6th grade reading performance, which increased 15 percentage points since 2019.
- 3rd Grade: +5 pp (43% in 2019 vs. 48% in 2023)
- 4th Grade: +3 pp (43% in 2019 vs. 46% in 2023)
- 5th Grade: +4 pp (51% in 2019 vs. 55% in 2023)
- 6th Grade: +15 pp (35% in 2019 vs. 50% in 2023)
- 7th Grade: +5 pp (47% in 2019 vs. 52% in 2023)
- 8th Grade: +3 pp (53% in 2019 vs. 56% in 2023)
Reading Mastery Declined in Every Grade Level: The percentage of students achieving “Masters” fell year-over-year in every grade level in reading. Texas’ highest achieving students scored lower this year than last year, resulting in a 5 point drop in students scoring Masters across all tested grade levels (including high school end of course exams). Some grades experienced up to an 11 point drop in Mastery.
- 3rd Grade: -11 pp (30% in 2022 vs. 19% in 2023)
- 4th Grade: -7 pp (28% in 2022 vs. 21% in 2023)
- 5th Grade: -8 pp (36% in 2022 vs. 28% in 2023)
- 6th Grade: -1 pp (22% in 2022 vs. 21% in 2023)
- 7th Grade: -11 pp (37% in 2022 vs. 26% in 2023)
- 8th Grade: -10 pp (37% in 2022 vs. 27% in 2023)
Passing Rates Remain Largely Stable Year-Over-Year: The number of students in the Approaches or higher category for 3rd through 8th grade reading and language arts remained generally similar to last year’s rates. In other words, roughly the same amount of students “passed” the STAAR this time around. This is important because the STAAR underwent significant changes to update the exam to more closely reflect the classroom experience. Sixth grade performance bucked this trend, with a 6 percentage point increase year over year, from 69% to 75% passage.
Math Performance:
The Percentage of Students at Grade Level Largely Increased Year-Over-Year But Remains Generally Below Pre-Pandemic Baselines: Across all grades, the percentage of students scoring “Meets” or higher either increased over the last year or remained stable. But also, across most grades, the percentage of students scoring “Meets” or higher remains below the pre-pandemic baseline. Fourth grade performance in 2023 has returned to the pre-pandemic baseline of 46% meeting grade level standards after dipping as low as 34% in 2021.
Passing Rates Improved Year-Over-Year But Remain Below Pre-Pandemic Baselines: Across all grades, the percentage of students scoring “Approaches” or higher increased over the last year. But also, across all grades, the percentage of students scoring “Approaches” or higher remains below the pre-pandemic baseline. This persistent challenge reflects national trends and warrants continued legislative attention.
- 3rd Grade: -6 pp (78% in 2019 vs. 72% in 2023)
- 4th Grade: -5 pp (74% in 2019 vs. 69% in 2023)
- 5th Grade: -4 pp (83% in 2019 vs. 79% in 2023)
- 6th Grade: -5 pp (79% in 2019 vs. 74% in 2023)
- 7th Grade: -12 pp (73% in 2019 vs. 61% in 2023)
- 8th Grade: -7 pp (81% in 2019 vs. 74% in 2023)
Mastery Levels Decrease in Early Grades but Improve in Middle School: Mastery levels have declined from pre-pandemic baselines in grades 3-7, but have improved back to match 2019 performance for 8th grade (at 16%). Year-over-year, fewer students achieved mastery in grades 3-5, as well as 7th grade.
- 3rd Grade: -2 pp (20% in 2022 vs. 18% in 2023)
- 4th Grade: -1 pp (22% in 2022 vs. 21% in 2023)
- 5th Grade: -3 pp (24% in 2022 vs. 21% in 2023)
- 6th Grade: 0 pp (15% in 2022 vs. 15% in 2023)
- 7th Grade: -2 pp (12% in 2022 vs. 10% in 2023)
- 8th Grade: +3 pp (13% in 2022 vs. 16% in 2023)
Science Performance:
Passage Rates Drop Slightly And Remain Below Pre-Pandemic Levels: The percentage of students passing the 5th and 8th grade science exams dropped slightly (-2pp & -1pp receptively) and remained below pre-pandemic levels.
- 5th Grade: -10 pp (73% in 2019 vs. 63% in 2023)
- 8th Grade: -7 pp (79% in 2019 vs. 72% in 2023)
On Grade Level Performance Increases for 8th Grade But Declines for 5th Grade, Widening the Gap from Pre-Pandemic Performance: The percentage of 8th grade achieving at or above “Meets” increase by 2 percentage points to 45%. 8th grade on grade level performance has continued to improve but remains 4 pp below 2019 levels. Only 34% of 5th graders Meet grade level expectations in Science, 13 percentage points less than in 2019.
Percentage of Students Achieving Mastery Declines: The number of students in Masters dropped slightly for both 5th and 8th graders by -2pp and -6pp receptively, continuing the trend that we are seeing in the other subjects. The percentage of students achieving “Masters” remains below pre-pandemic levels.
- 5th Grade: -8 pp (23% in 2019 vs. 15% in 2023)
- 8th Grade: -8 pp (24% in 2019 vs. 16% in 2023)
Social Studies Performance:
8th Grade Social Studies Achievement Shows Minor Increase in Passage and On Grade Level Performance But Is Still Lower Than Pre-Pandemic Levels: Slightly more students scored Approaches or higher than last year (+1 pp), but overall passage rates are 7 percentage points below pre-pandemic levels. A small year-over-year increase in grade level performance (+2 pp) was offset by an equal decline in mastery (-2 pp).
High School History Achievement Outshines 8th Grade Achievement, By More than Double: Overall, 50% of tested students are on grade level in social studies, but achievement in U.S. History is what brings up that average. Only 31% of 8th graders are achieving Meets grade level expectations vs the 71% of high schoolers achieving Meets on U.S. History.
Read more:
- Does “passing” the STAAR mean your student is on grade level?
- What outcomes can we expect for the graduating class of 2036?
- Aiming for mastery: Where to focus on student testing
Love this blog? Support our work.