

Two big education data weeks are coming to Texas.
- On June 10, we get STAAR End-of-Course results AND updated NAEP Long-Term Trend scores for 9- and 13-year-olds.
- On June 16, STAAR grades 3–8 results drop.
Here’s what we’ll be watching.
The National Lens: NAEP Long-Term Trends (June 10)
The NAEP Long-Term Trend (LTT) provides an age-based, national snapshot on student learning in math and reading. This assessment shows changes in student knowledge across generations, dating back to the 1970s. Results are reported only at the national level.
The last LTT results, released in 2022 and 2023, painted a sobering picture.
- For 9-year-olds, the average reading score fell 5 points and the average math score fell 7 points compared to 2020, the largest single-cycle math decline since the assessment began.
- For 13-year-olds, reading dropped 4 points and math dropped 9 points from 2020, with math scores down 14 points since 2012.
These declines, in part, reflect learning losses associated with the COVID-19 pandemic.
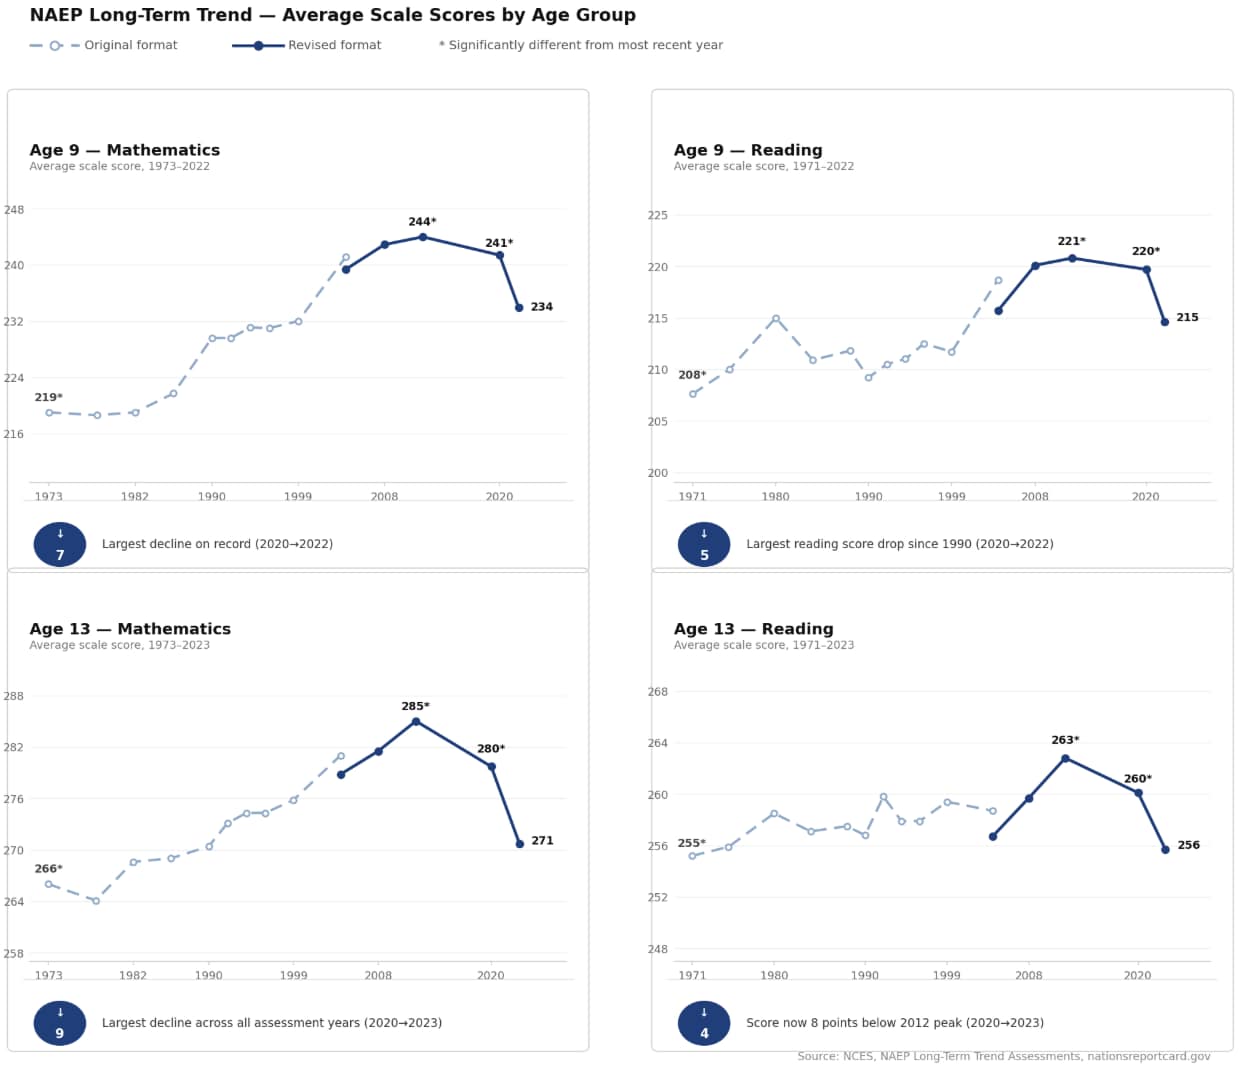
Scores marked with an asterisk (*) were statistically different from the most recent assessment year, meaning the gap reflects a real change rather than sampling variation. The most recent year carries no asterisk because it serves as the reference point against which all prior years are compared.
The June 10 release will tell us whether those declines have stabilized, continued or reversed.
STAAR End-of-Course Results (June 10)
The five EOC assessments — Algebra I, Biology, English I, English II, and U.S. History — measure whether high school students have mastered core content. The most recent results (SY 2024–25) showed mixed signals.
Biology recovered strongly, with 61% of students meeting or exceeding grade level, nearly matching the pre-pandemic mark of 62%. U.S. History held steady at 68%. English I and English II have gradually climbed back and surpassed pre-pandemic baselines.
Algebra I remains the starkest outlier. Only 45% of students met grade level in SY 2024–25, compared to 61% in SY 2018–19. That 16-point gap represents a critical warning sign given the role algebra plays as a gateway course.
Watch for Algebra I: At 45% meets grade level in 2024-25, results remain 16 percentage points below SY 2018-19. This persistent gap is one of the most pressing challenges in Texas secondary education.
STAAR Grades 3–8 Results (June 16)
Reading performance in grades 3–8 has broadly recovered. In SY 2024–25, meets-grade-level rates ranged from 52% (Grade 3) to 58% (Grades 5 and 8), at above pre-pandemic levels in most grades. That represents progress, and a testament to investments in literacy instruction.
Math tells a different story. As of SY 2024-25, Grade 7 math stood at just 33% meets grade level — well below the 43% recorded in SY 2018–19. Grade 6 math was at 40%, essentially flat for four consecutive years. The COVID dip hit math harder than reading, and recovery has been uneven.
Watch for whether gains in elementary grades are translating to the middle grades, and whether targeted math interventions are showing up in the data for economically disadvantaged students and English learners.
Why It All Matters
These two weeks of data releases will offer a layered view of student learning: NAEP provides the national context, STAAR provides the Texas-specific measure against state standards.
Together, they allow educators, policymakers, and families to ask questions: Are our investments in curriculum and instruction working? Are the students who fell farthest behind catching up? And are we equipping every Texas student with the foundation they need to succeed?
Texas 2036 will be closely tracking these releases. Stay tuned for our analysis.