

This is a preview of our Texas 2036 newsletter discussing Texans’ confidence in the state’s economic future and a data analysis of workforce trends in the state. To receive this weekly look at our work, sign up here.
Texas Is Adding Jobs, But Not Everywhere
Texas has an established reputation as a job dynamo. But its workforce is changing, along with the skills Texans need to secure the family-sustaining jobs of the future.
Over the past year, Texas’ job growth was strong at the state level. But where that growth landed was uneven. Fewer than half of Texans live in a county where employment grew — a gap that never shows up in the statewide total.
That’s why Texas 2036 looks beyond the statewide totals. By tracking labor force growth, population trends and where jobs are being added, we can better understand how Texas’ economy is changing and what the state should prepare for next.
Texas Jobs Are Growing Faster Than the Nation

Source: Bureau of Labour Statistics, Current Employment Statistics, seasonally adjusted.
Texas employers reported 14.5 million jobs in July – 165,600 more than a year earlier. That’s a gain of 1.2%, compared to the national gain of 0.2% over the same 12 months.
The state’s labor force — everyone 16 and older who is working or actively looking for work — grew by 0.1% to 15.9 million during a time when the nation’s fell by 0.8%.
The Big Takeaway: Texas accounted for roughly half of the nation’s net job growth in the 12 months through July. It also added workers in a year when the country lost workers.
Sources: BLS Current Employment Statistics. Total nonfarm employment; BLS, Local Area Unemployment Statistics; BLS Civilian Labor Force Level [CLF16OV]); U.S. Bureau of Labor Statistics, Current Population Survey. National unemployment rate (U-3); all numbers are seasonally adjusted and based on July 2026 vintage data.
Professional, Business Services Power Job Growth

- Largest sector: Trade, transportation and utilities accounts for 2.8 million jobs, or about 1 in 5 Texas jobs.
- Most jobs added: Professional and business services added roughly 67,000 jobs, more than any other sector. That represents 40.5% of Texas’ net gain over the past year and brings the sector’s total to 2.2 million jobs.
- Government work declines: Government employment, which accounts for 2.1 million jobs, declined over the past year, dropping government from Texas’ second- to third-largest employment sector.

- Sectors losing jobs: Information (-4.9%), manufacturing (-0.6%), financial activities (-0.3%) and government (-0.2%) lost jobs over the past year.
Not All Of Texas Is Sharing In the Growth
More Texas counties added jobs than lost them
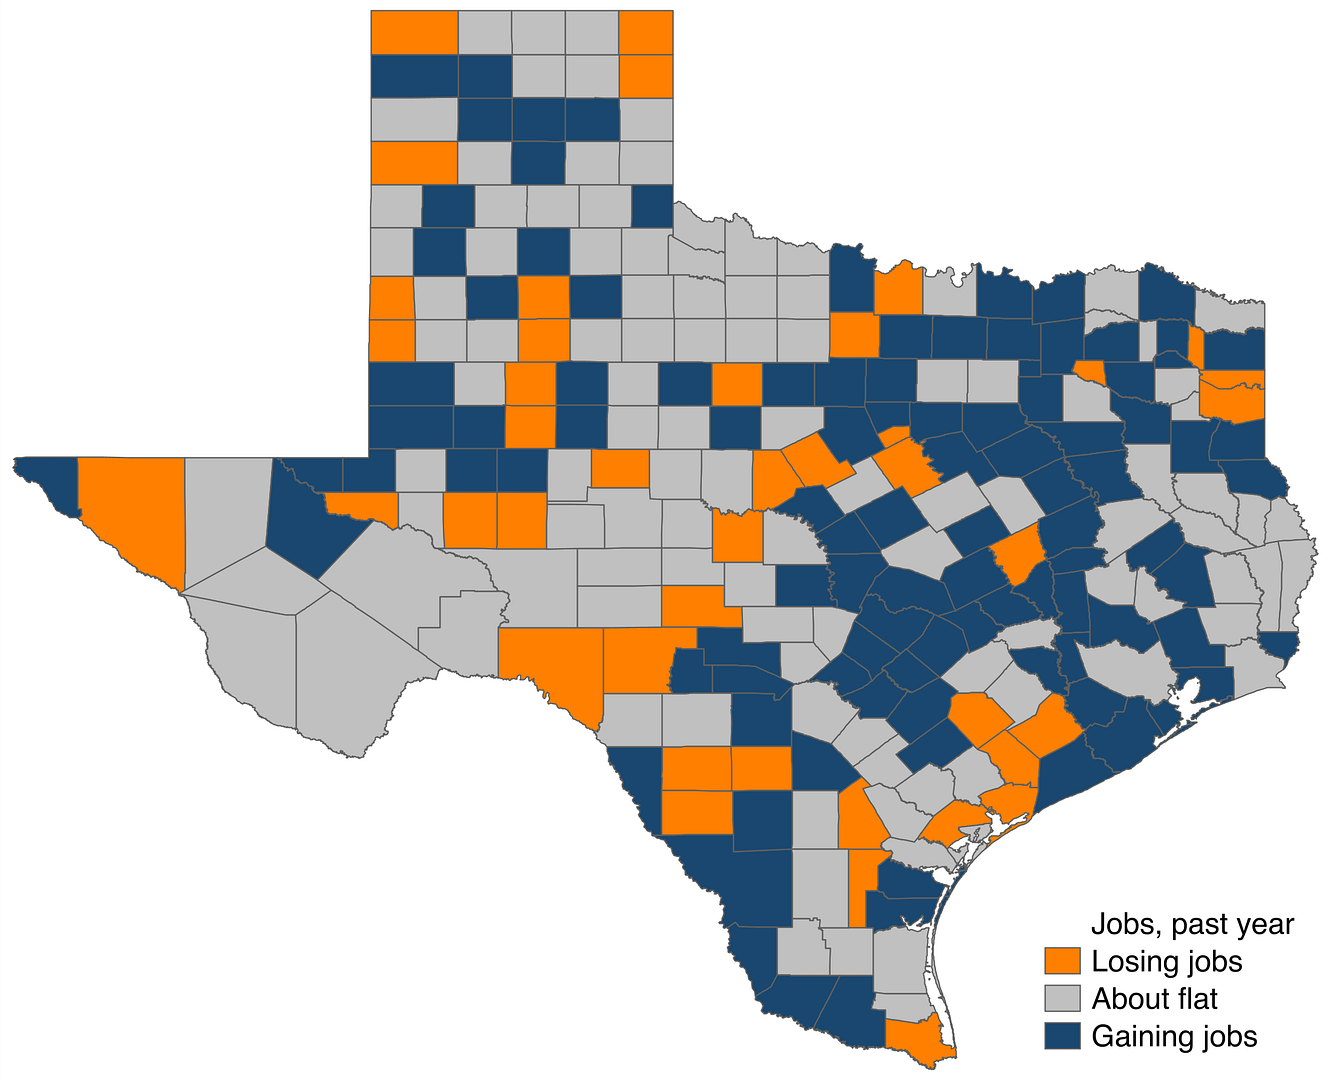
Source: BLS, QCEW, county annual averages, 2024 and 2025; change is defined as >= 1% growth/loss of jobs and at net change of 50 or more jobs per county.
Statewide totals can obscure how differently Texas counties are performing. Over the past year:
- Employment increased in 103 counties, or 40.6%.
- Employment declined in 42 counties, or 16.5%.
- Employment remained flat in 109 counties, or 42.9%.
Why it matters? 53% of Texans live in a county where employment fell or stayed flat over the past year.
Poll: Voters Are Confident in Job Prospects
In Texas 2036’s new Texas Voter Poll, 59% of Texas voters said they were confident there will be good opportunities for people like them over the next few years. A third (34%) were not.
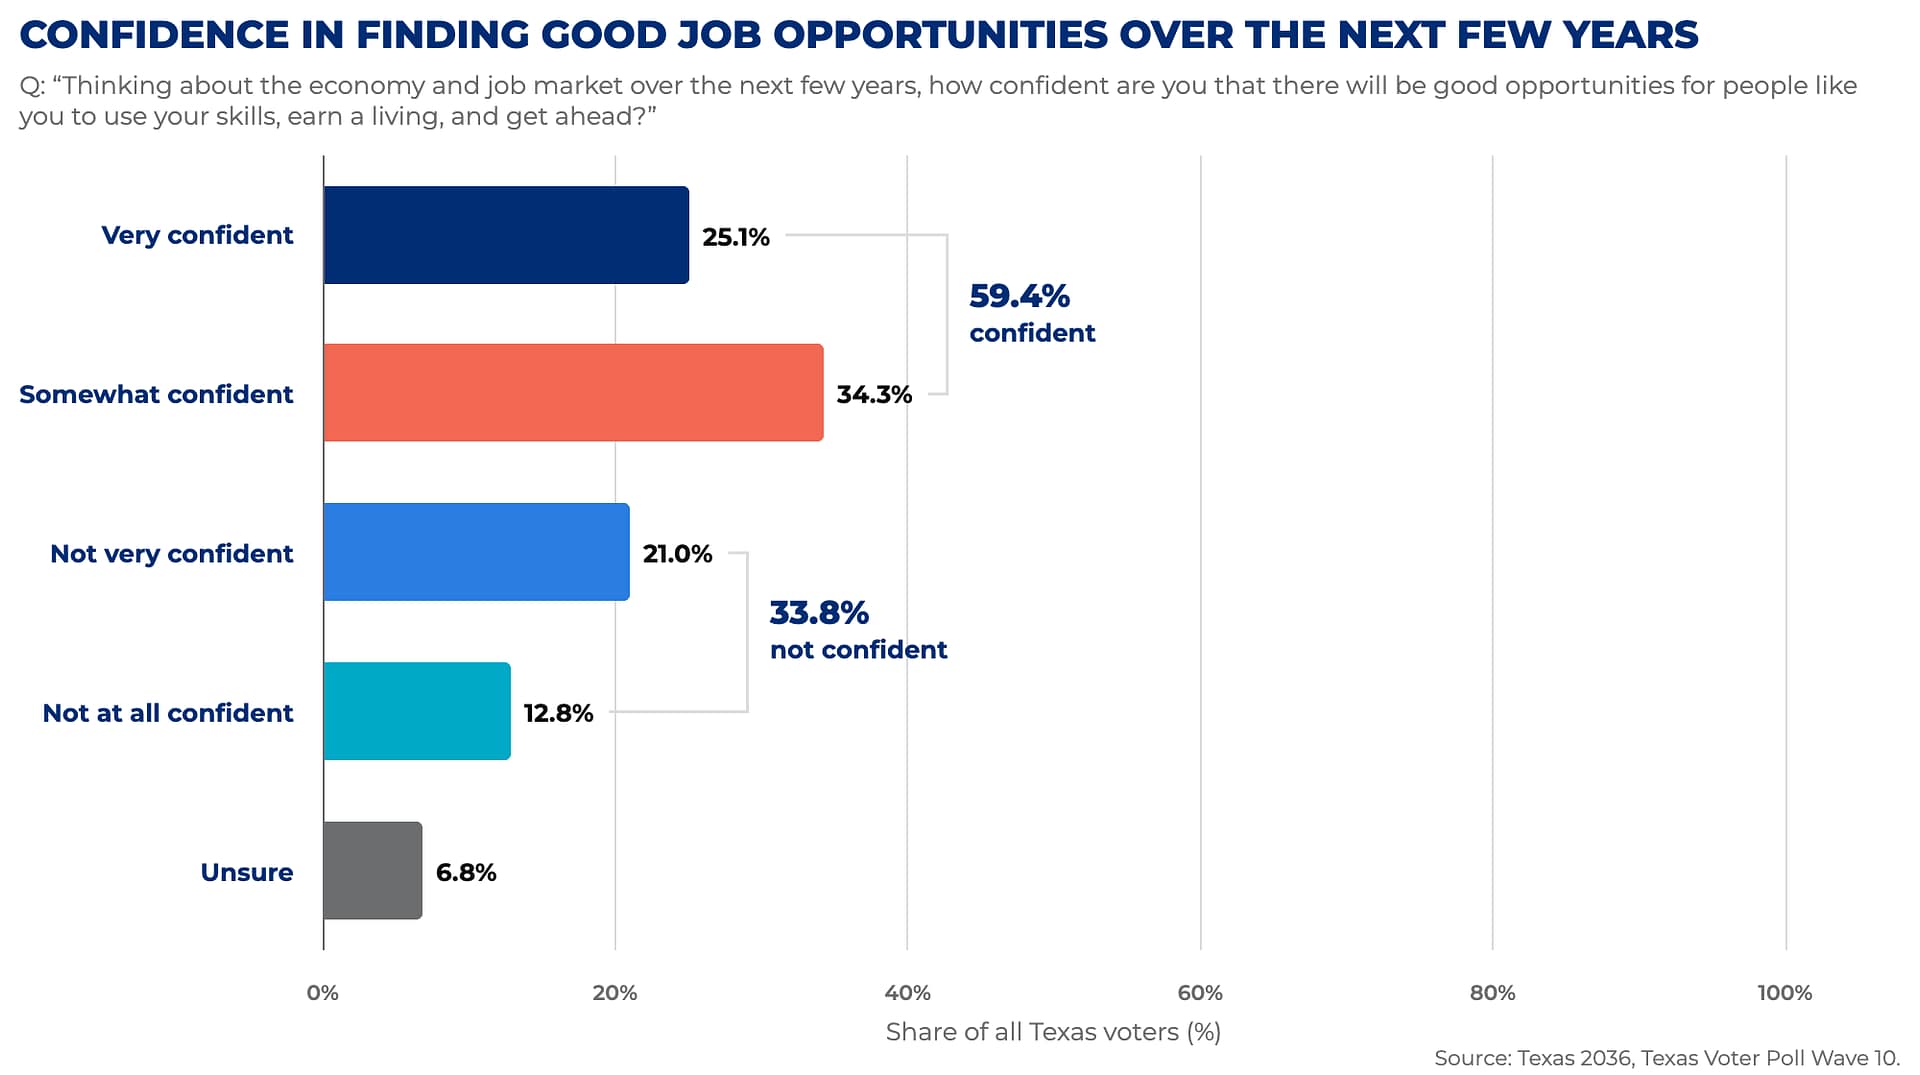
Sources: U.S. Bureau of Labor Statistics Quarterly Census of Employment and Wages. The population share weights each county using its July 1, 2025, census population estimate; 10th Texas Voter Poll, conducted Aug. 22–26, 2026, by Baselice & Associates for Texas 2036; 1,369 completed interviews; effective sample size after weighting: 1,001 (margin of sampling error: ±3.1 percentage points)
Four Counties, Four Employment Patterns
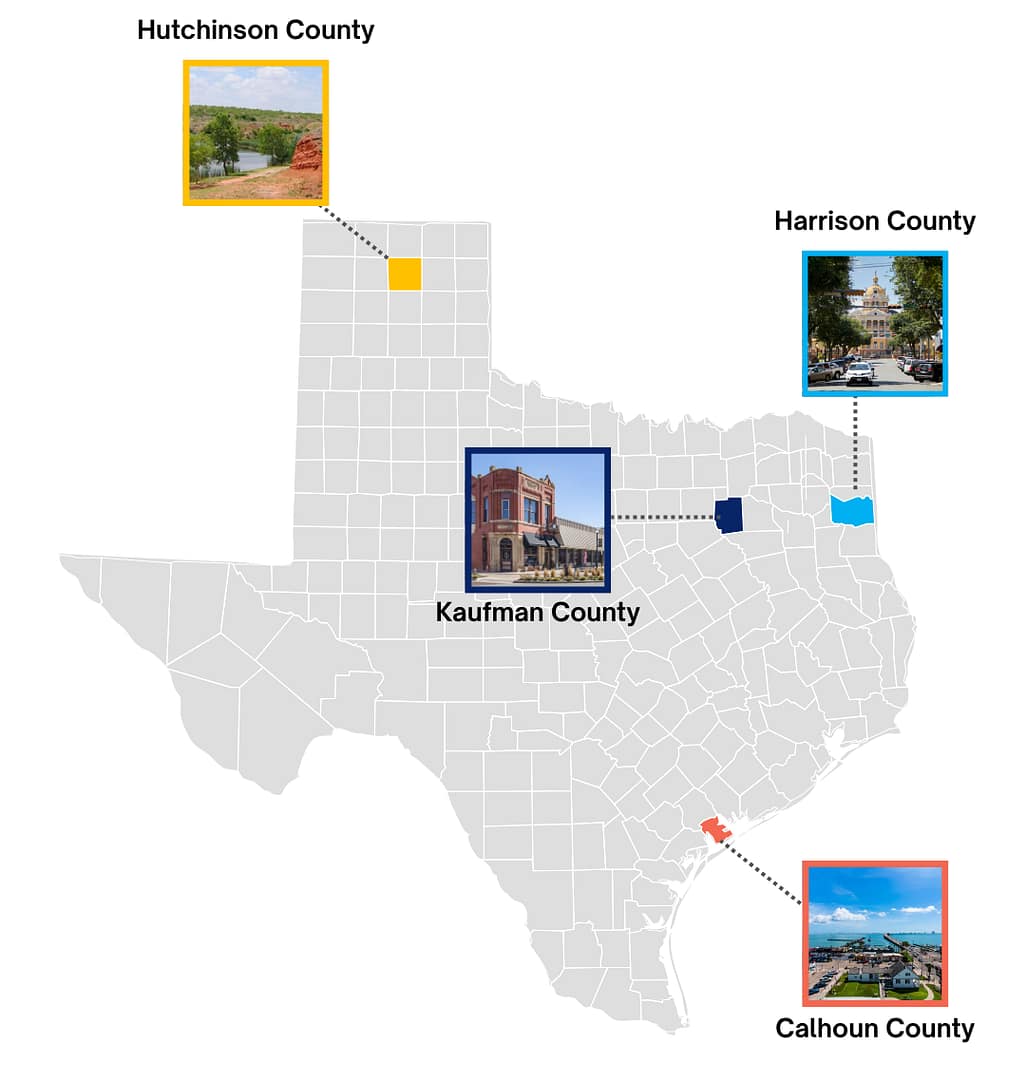
County data shows where employment grew, declined or held steady. It does not explain what may be driving those changes.
To dig deeper, Texas 2036 examined four counties with different combinations of job growth, population change and industry concentration.
How we chose these counties: We ranked all 254 Texas counties on how employment changed over the past five years. We then picked one clear example of each pattern over the past year — strong growth, decline, flat, and flat with a sharp one-year change — from four different parts of the state.
Section Data source: BLS, QCEW, county annual averages, 2015 – 2025
Kaufman County: Employment Strongly Rising

- Jobs: Up 40.6% over five years and 5% over the past year.
- Population: Up 44% over five years, making Kaufman Texas’ fastest-growing county since 2020.
- Job density: 21.9 jobs per 100 residents.
- Largest sector: Trade, transportation and utilities, with 30.4% of county jobs.

Kaufman County
Location: Southeastern edge of Dallas-Fort Worth
What Stands Out: Trade, transportation and utilities accounts for 30.4% of local jobs. Over five years, employment grew 40.6% alongside 44% population growth.
Harrison County: Employment Decline

- Jobs: Down 4.9% over five years and 2.3% over the past year.
- Population: Up 4.5% over five years.
- Job density: 29.3 jobs per 100 residents.
- Largest sector: Manufacturing, with 24.5% of county jobs.

Harrison County
Location: East Texas
What Stands Out: Manufacturing accounts for 24.5% of local jobs and was the largest contributor to the county’s employment decline over the past year.
Hutchinson County: Employment Holding Flat

- Jobs: Up 0.1% over five years and 0.8% over the past year.
- Population: Down 4.7% over five years.
- Job density: 39.3 jobs per 100 residents.
- Largest sector: Education and health care, with 17.5% of county jobs.

Hutchinson County
Location: Panhandle
What Stands Out: No sector accounts for more than 17.5% of local jobs, making Hutchinson the least concentrated of the four counties. It added only five jobs over five years.
Calhoun County: Sharp One-Year Decline

- Jobs: Up 4.2% over five years but down 7.3% over the past year.
- Population: Down 2.5% over five years.
- Job density: 66.6 jobs per 100 residents.
- Largest sectors: Manufacturing, with 31.6% of jobs, followed by construction at 24.1%. Construction accounted for 84.4% of the net loss of 1,024 jobs over the past year.

Calhoun County
Location: Port Lavaca/Gulf Coast
What Stands Out: Manufacturing and construction account for more than half of local jobs. Construction alone accounted for 84.4% of the net loss of 1,024 jobs over the past year.

“Texas’ economy is still outgrowing the country’s. But the same data shows job growth slowing for four straight years, and that growth reaching some parts of the state and not others.
“That’s why we watch these trends closely — to see what’s coming for Texas’ labor force, while there’s still time to prepare.”
– Dr. Tracy Ayrhart, Vice President of Data and Research, Texas 2036
What Texas 2036 Is Watching

Today’s employment numbers are only part of the picture. Four trends will help shape the size, skills and distribution of Texas’ future workforce.
1. Labor force growth is slowing.
Texas added jobs at a rate of 1.2% over the past year, but its labor force grew just 0.1%. That is down from a decade-high 3.3% in 2023 and below the 1.8% average annual growth of the past decade. Falling fertility, declining net migration and an aging population could further slow growth in the working-age population.
2. AI is beginning to reshape hiring.
The Dallas Federal Reserve found that two-thirds of Texas firms currently use AI, and another 18% plan to begin within a year. Among those firms, 44% expect no change in staffing, 26% expect to need fewer workers and 20% expect to need workers with different skills.
The shift may already be underway. By early 2025, job postings for occupations most exposed to AI automation had fallen about 8% relative to less-exposed occupations within the same industries. Researchers expect first-time job seekers and career changers to feel the effects first.
3. Better workforce data is coming.
In Texas 2036’s new 10th Texas Voter Poll, 85% of Texas voters supported requiring the state to track and publicly report whether the more than $100 billion Texas invests annually in education and job-training programs leads to good-paying jobs. This includes 57% who reported strongly supported the requirement.

That kind of tracking requires data Texas does yet collect in wage records, including a worker’s occupation and county of employment and industry. Senate Bill 1786 directs the Texas Workforce Commission to add that information, helping the state evaluate how well education and training programs prepare Texans for available jobs. The expanded records will also support a biennial assessment of regional labor demand.
4. Timely data is necessary to ensure education and workforce resilience.
Data siloes in Texas agencies can mean it takes a year or more for policymakers to understand whether graduates are finding good jobs in their communities.
Faster integration of education and workforce data would help programs keep up with the rapid pace of labor market change and ensure Texans are prepared for good jobs.
Learn more: Dallas Fed Texas Economic Indicators · Dallas Fed Texas Employment Forecast · Texas Workforce Commission Labor Market Information (TWC LMI) · U.S. Bureau of Labor Statistics Quarterly Census of Employment and Wages (BLS QCEW) · Comptroller TexStats
What are you seeing where you live?
The data shows where employment is changing. Local perspectives can help us understand what those shifts mean for workers, employers and communities.
Tell us what you’re seeing in your county through our one-minute survey.