
As health care expenditures have increased, so have our health problems
Rising health care spending is a profound challenge for the U.S. and Texas. A priority at Texas 2036 is to ensure health care affordability and its impact on quality of life. In our Strategic Framework, we use data related to System Affordability and Health Outcomes to examine total health care expenditures and health outcomes like morbidity and mortality statewide. Here, we dive into the data.
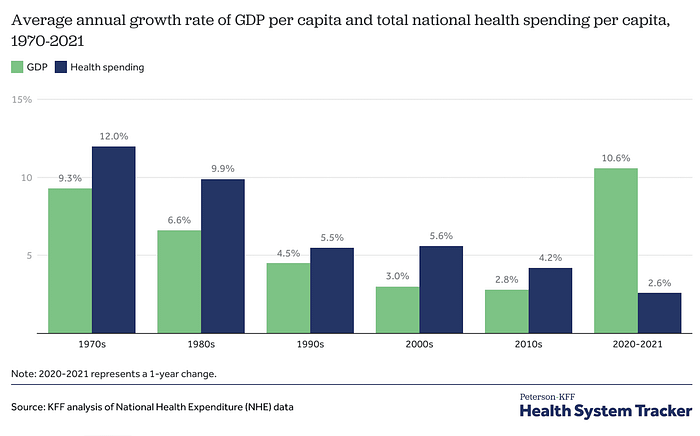
How long have health care expenditures been increasing?
The nation’s problem with overall health care expenditures has grown significantly in the last six decades. Since the 1970s the rate of health care spending growth outpaced growth in U.S. Gross Domestic Product up until 2020. And while the rate of growth has slowed over the last two years observed, the overall amount of health care expenditures remains large – nearly one fifth of the U.S. economy.
Rising health care expenditures concern governments and individuals alike. For governments, rising health care spending means reduced spending in other important areas like education or infrastructure. At the individual level, rising health care expenses disrupt peoples’ livelihoods and can cause financial strain on families.
Even as health spending continues to rise, health outcomes have remained the same or gotten worse
Increased spending on health care does not always translate into increases in quality. Even as Americans are paying more for health care, our health outcomes remain the same or are getting worse.
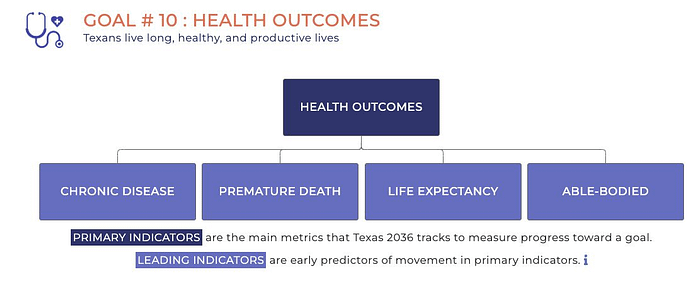
In our Strategic Framework, we have been tracking several health outcomes among Texans, including self-reported health, prevalence of chronic diseases, disabilities, estimated life expectancy and years of life lost.
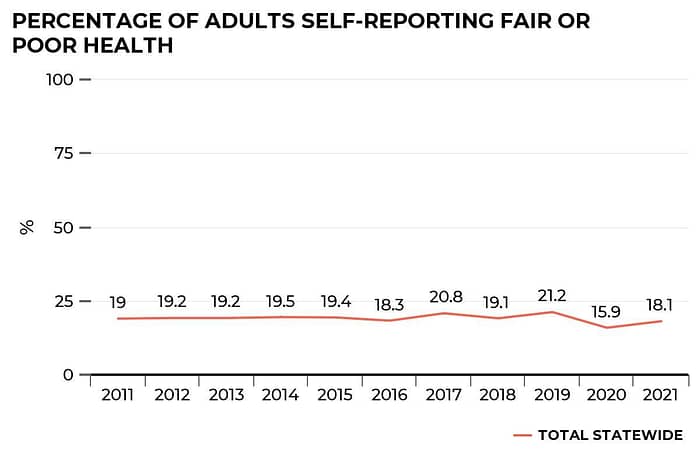
We found that many Texans continue to assess their own overall health as substandard. Dating back to 2011, the percentage of Texas adults who reported fair or poor health has varied between 18.1% and 21.2% every year except for 2020, where the percentage dipped to 15.9%. People who reported fair or poor health outcomes were more likely to be women and to have a lower income. While there has been some variance year to year, this metric has remained largely static.
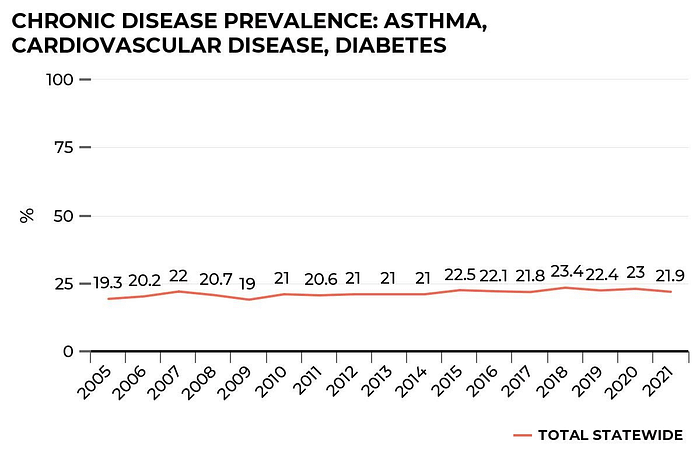
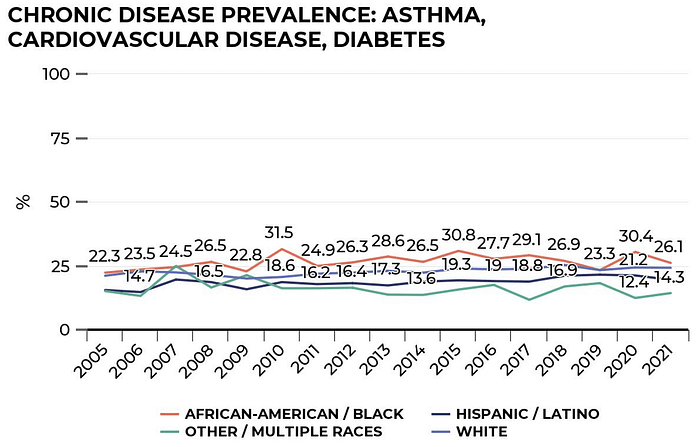
We also track the prevalence of disease status. One in every five people had one or more chronic diseases such as asthma, cardiovascular disease and diabetes. In 2005, 19.3% of Texas adults reported having one or more of these diseases. Over time there has been a small increase – by 2021, the figure stood at 21.9%.
Black Texans reported the highest prevalence of chronic diseases overall with an increase from 22.3% in 2005 to 26.1% in 2021. White Texans were the second with 21.1% in 2005 to 24.2% in 2021 compared to Hispanic/Latino Texans, whose chronic disease prevalence increased from 15.5% in 2005 to 19.5% in 2021.
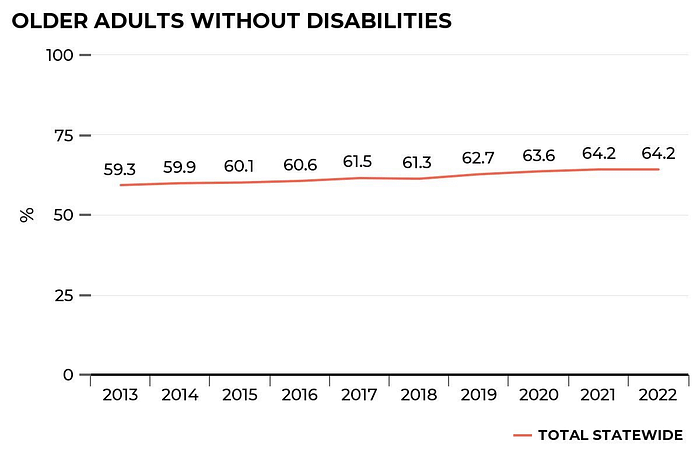
In contrast, we found the number of older adults without disabilities have increased in the last 10 years. In 2022, the number of adults aged 65+ without disabilities was 64.2%, up from 59.3% in 2013. This is a promising sign that older Texans have a reduction in disabilities of 5% since 2013.
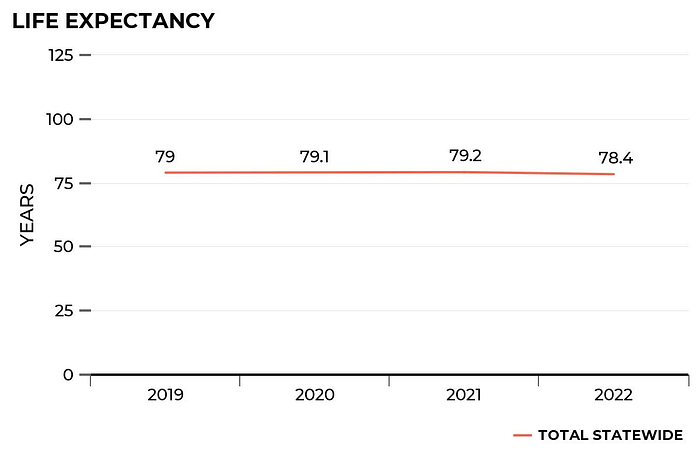
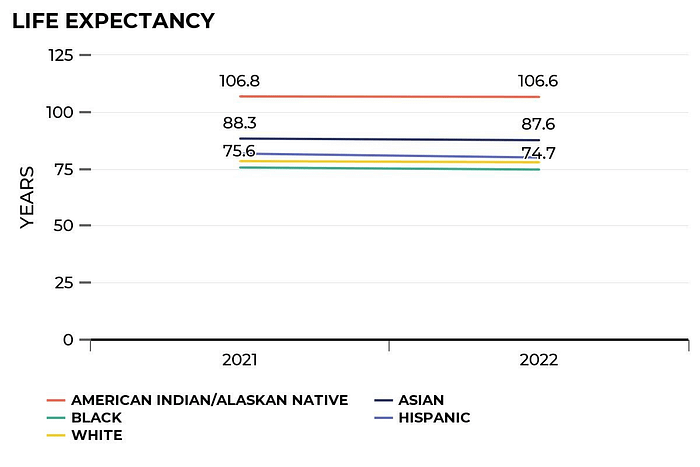
Furthermore, Texans’ life expectancy has decreased since 2019. In 2022, life expectancy was 78.4 years, but it was 79 in 2019. Racial differences may also account for some trends in life expectancy. For instance, Asian Texans had a life expectancy of 87.6 years, which is nearly 13 years more than black Texans.
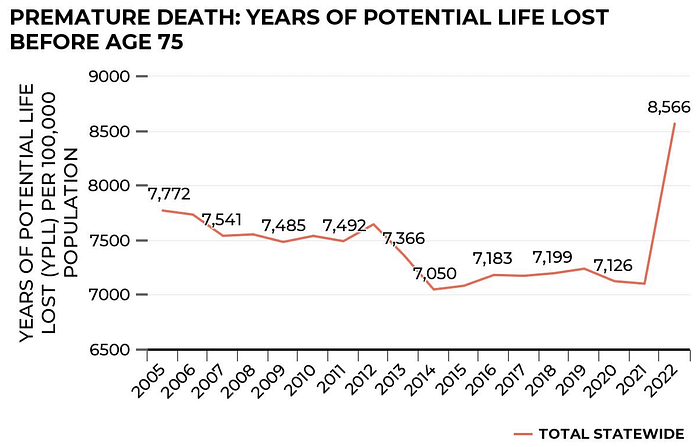
Lastly, what had been a somewhat positive story has become less so due to a recent reversal since 2020 with regard to premature deaths. According to JAMA, increases in potential life lost since 2000 are attributed to drug overdoses such as alcohol and drug poisonings and suicide. Between 2005 and 2020, the years of potential life lost, or YPLL, before age 75 had decreased from 7,772 per 100,000 people to 7,126 per 100,000 in 2020. But between 2020 and 2022, YPLL increased by 1,440 deaths per 100,000 people. In 2020, the National Center for Health Statistics WISQARS Report, attributed the leading causes of death for YPLL to unintentional injury, suicide, homicide, COVID-19, cancer, heart disease and liver disease.
While our total expenditures on health care services have continued to rise, we haven’t seen corresponding increases in the health outcomes that we’re measuring.
Stay tuned for future blogs that examine our health care spending in greater detail such as:
- Competitive Hospital markets of Texas
- Total Health Care Expenditures by Health Care Service and Product
- Understanding the reasons why U.S. health care expenditures are higher compared to other countries, and
- Exploring solutions to help reduce our health care spending without harming health outcomes.