

This is Part 1 in a multi-part data analysis of Texas’ uninsured population; this part includes a county-level analysis of the state’s uninsured.
According to the U.S. Census Bureau, Texas has the highest uninsured rate in the nation, with 16.4% of its population lacking health care coverage. Without insurance, individuals are less likely to receive regular checkups, preventive care, or early diagnoses. Instead, they often delay seeking care until a medical emergency occurs, leading to more expensive treatment and worse health outcomes.
For instance, a Texas 2036 focus group study of uninsured individuals found that 88% of respondents planned to use the ER for major emergencies, 43% would use the ER for minor emergencies, and 36% would go to the ER for preventative care.
 Source: U.S. Census Bureau, S2701 2023 ACS 1-Year Estimates
Last year, Texas 2036 explored the barriers that prevent Texans from obtaining health coverage in a report titled Who Are The Uninsured? Building on this work, this blog examines which counties have the largest uninsured populations. Using data from the U.S. Census Bureau’s American Community Survey (ACS), we mapped the total number of individuals without health coverage in each county.
This map highlights counties with uninsured populations up to 300,000 people. Scroll the figure below for the full list of uninsured individuals by county across Texas.
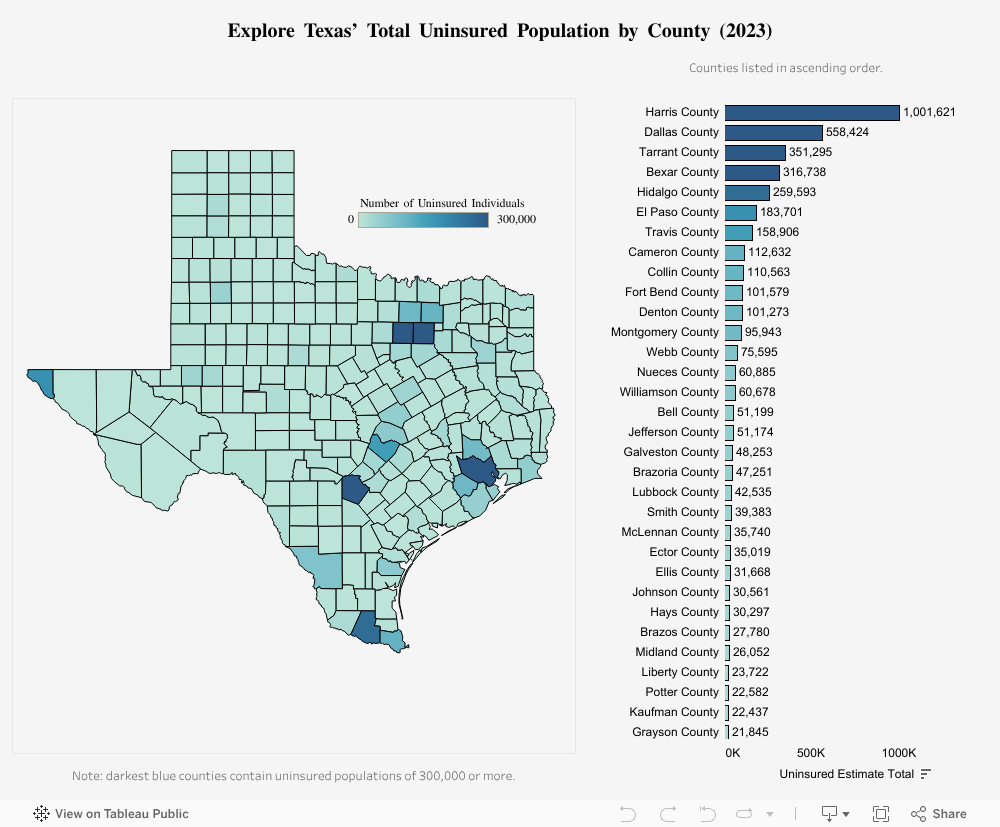
The counties creating the Texas Triangle have the largest overall populations and also make up the largest health care coverage gaps, with more than 300,000 uninsured.
However, raw numbers tell a different story than percentages. Counties like Harris County have a large number of uninsured individuals, a function of their large total population.
These are the ACS 5 year 2023 Total Population Estimates of the counties in the Texas Triangle:
- Harris County (Houston)
- 4,758,579 Total Population
- 1,001,621 Uninsured Population
- Dallas County (Dallas)
- 2,603,816 Total Population
- 558,424 Uninsured Population
- Tarrant County (Fort Worth)
- 2,135,743 Total Population
- 351,295 Uninsured Population
- Bexar County (San Antonio)
- 2,037,344 Total Population
- 316,738 Uninsured Population
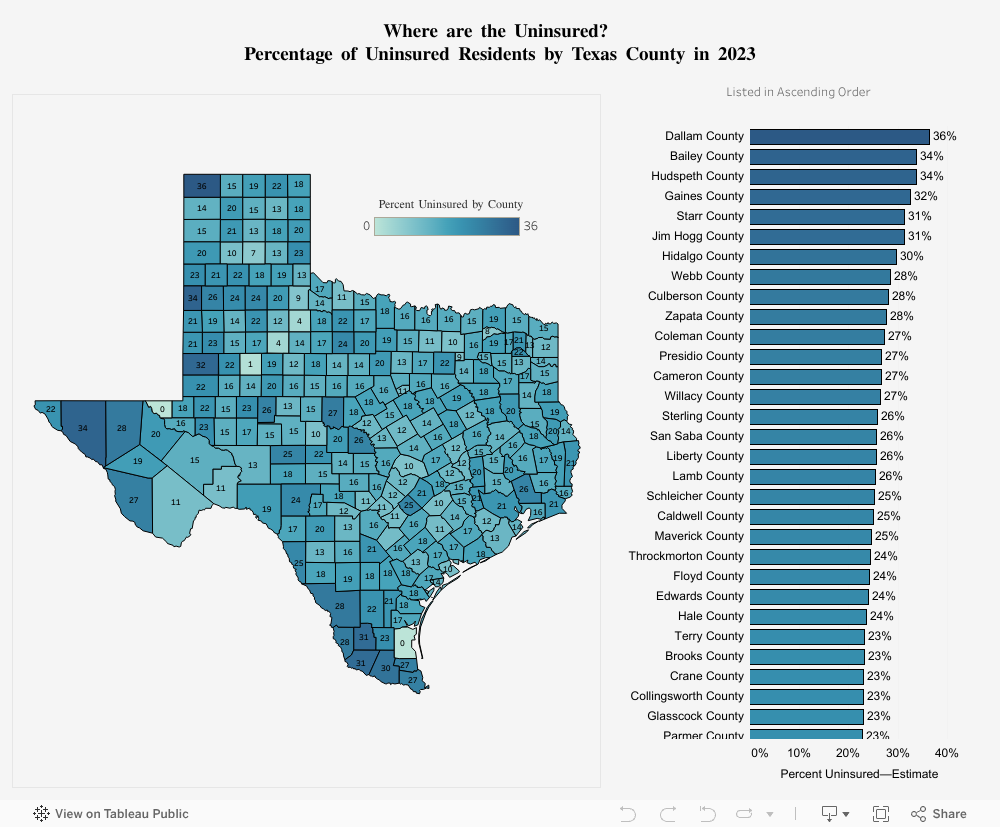
In reality, after examining the percentage of uninsured residents within each county, smaller and rural counties actually have a larger share of the population without health insurance even though their population is much smaller.
Counties within the Texas Triangle have large uninsured populations with 20-25% lacking health coverage. However, the darkest blue counties on the map — representing the highest percentage of uninsured populations — are concentrated in the Texas Panhandle, West Texas, and in and around the Lower Rio Grande Valley. The percentage of the uninsured in these counties range between 22% and 36%. Notably, Dallam, Bailey, Hudspeth, and Gaines County each have more than one-third of their population without health coverage. Scroll through the figure below to view the percentage of uninsured residents in each Texas county.
When looking at the uninsured population by sex, males were more likely to be uninsured than females in most counties. For the 10 counties with the largest percentages of the uninsured (left table below), 29.83% of their population, on average, lacked health coverage. To see every county’s sex breakdown, scroll through the right figure below.
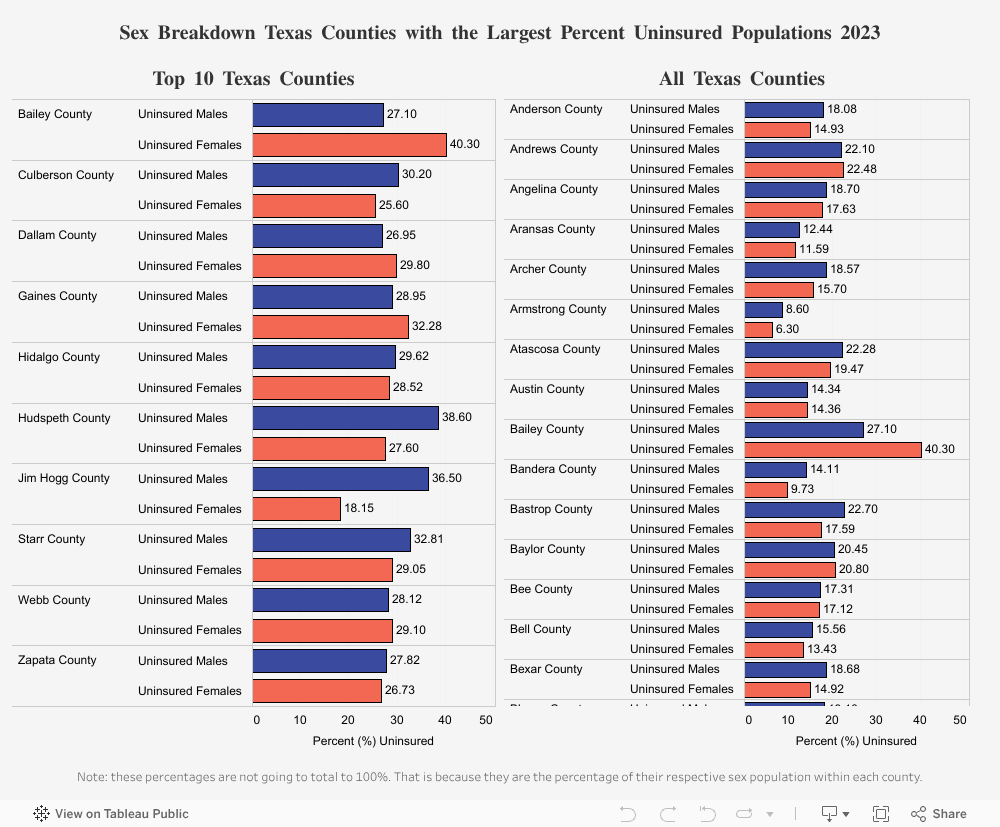
While males make up the majority of the uninsured population across most counties, there are a few notable exceptions. In Bailey, Dallam, Gaines, Hudspeth, Maverick, McMullen, Presidio, Starr, Webb, Yoakum, and Zapata counties, more females are uninsured than males. For example, in Bailey County, 40% of the female population is uninsured — the highest uninsured percentage among both sexes across all counties. In comparison, the highest uninsured percentage among males is in Hudspeth County, where 38% of men lack health coverage.
| Counties with a Higher Percent Uninsured Female Population | |||
| County Name | Uninsured Males (%) | Uninsured Females (%) | |
| Bailey County | 27.10 | 40.30 | |
| Dallam County | 26.95 | 29.80 | |
| Gaines County | 28.95 | 32.28 | |
| Hudspeth County | 38.60 | 27.60 | |
| Maverick County | 21.89 | 26.60 | |
| McMullen County | 6.70 | 26.40 | |
| Presidio County | 24.60 | 25.75 | |
| Starr County | 32.81 | 29.05 | |
| Webb County | 28.12 | 29.10 | |
| Yoakum County | 19.60 | 29.75 | |
| Zapata County | 27.82 | 26.73 | |
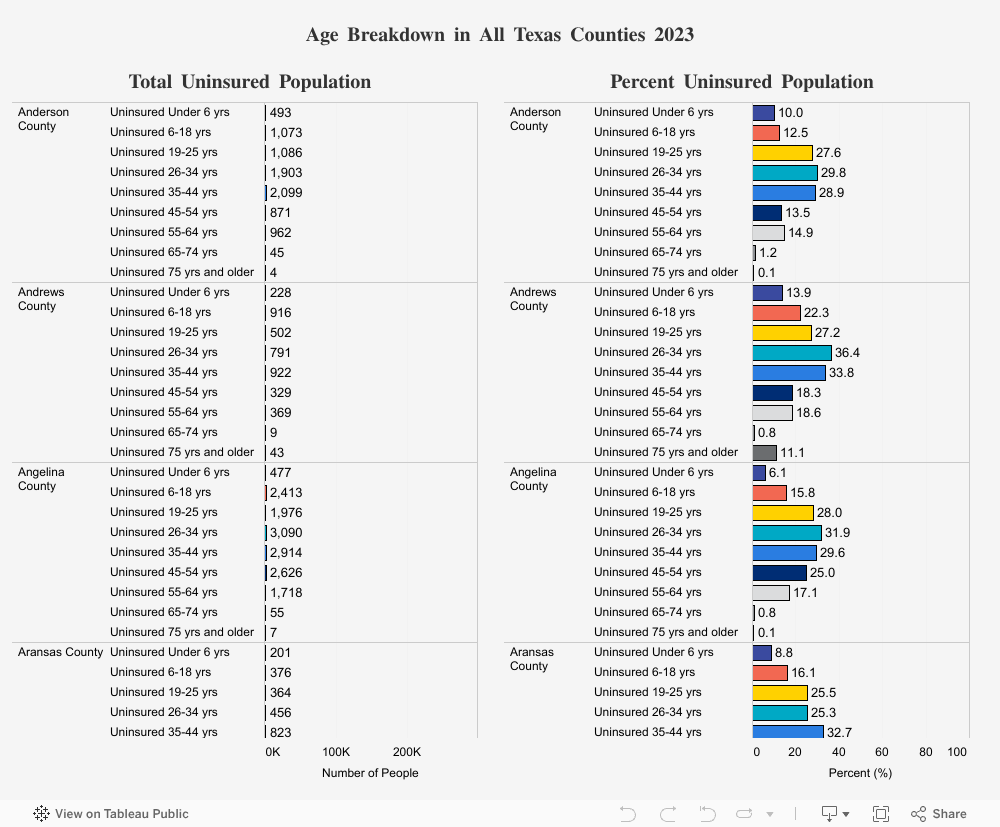
Analyzing the uninsured population by age group reveals patterns in coverage gaps and helps pinpoint target groups for enrollment efforts. View the figure below to see both the number of uninsured individuals and the percentage of the population they represent.
The Top 5 Key Takeaways:
1. Texas Leads the Nation in Uninsured Rates
- Texas has the highest uninsured rate in the country, with 16.4% of residents lacking health coverage, according to the U.S. Census Bureau.
- Lack of insurance often results in delayed care, overreliance on emergency rooms, and poorer health outcomes.
2. Major Urban Counties Have the Largest Uninsured Populations by Number
- Harris, Dallas, Tarrant and Bexar counties each have over 300,000 uninsured residents.
- These high numbers reflect the overall large populations of these urban areas rather than uniquely high uninsured percentages.
3. Rural Counties Face the Highest Uninsured Percentages
- Smaller and rural counties, particularly in the Texas Panhandle, West Texas, and the Lower Rio Grande Valley, have the highest percentages of uninsured residents.
- In counties like Dallam, Bailey, Hudspeth and Gaines, more than one-third of the population lacks health insurance.
4. Gender Disparities in Uninsured Percentages
- In most counties, males are more likely to be uninsured than females.
- However, in 11 counties — including Bailey, Dallam, Gaines and Zapata — females are more likely to be uninsured.
- Bailey County stands out with 40% of its female population uninsured, the largest among both sexes across all counties.
5. Emergency Rooms Are a Go-To for Uninsured Care
- A Texas 2036 focus group found high reliance on emergency departments among uninsured individuals, even for preventive care, highlighting the gap in regular, affordable health care access.
Data can help policymakers and health officials target areas in need of more resources. By diving deeper into the numbers, we can see population trends that can give us insights to understand what barriers to health care coverage exist among specific populations and inform smarter policy decisions.
In the next blog, we examine which census tracts account for the highest uninsured populations within each county.