
This is a preview of our Texas 2036 newsletter that dives into the new edition of our Strategic Framework. To receive this weekly highlight of our work, sign up here.
Strategic Framework: Shaping Our Future 💫
In 2036, Texas will celebrate its bicentennial: 200 years of growth, change, adversity, perseverance and achievement. As we look ahead, it’s time to take stock of where we have been, where we are today and where we want to go.
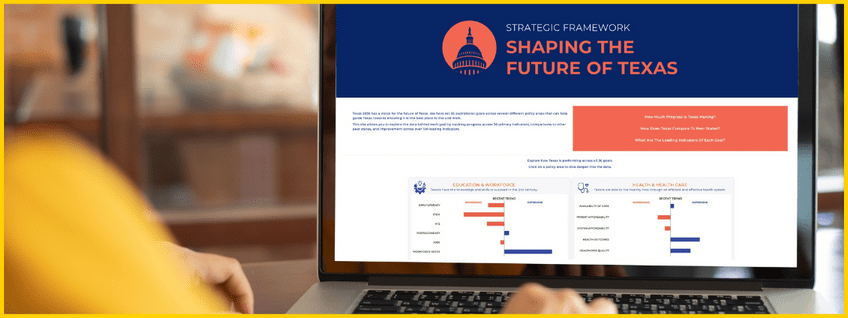
Setting the Scene: “Shaping Our Future: A Strategic Framework for Texas” is a resource for the state’s officeholders, influencers and the public.
- We met with more than 170 members of our Policy Advisory Groups and engaged with external stakeholders and subject matter experts to create our Strategic Framework report and its accompanying interactive dashboard.
An Ambitious, Achievable Task: Our Strategic Framework measures 36 goals linked to the long-term prosperity of Texas and its people.
- It lays out more than 150 metrics to chart the state’s progress toward achieving these goals.
Why This Matters: To help inform key decisions about the most significant issues facing the state, the Strategic Framework includes in-depth, cross-cutting data available to all Texans.
- Nearly 10 million more Texans are expected to live here by 2036—long-term planning is a must.
Dive deeper: “Your Guide to the Strategic Framework“
“Peer States”: How Does Texas Stack Up? ⭥
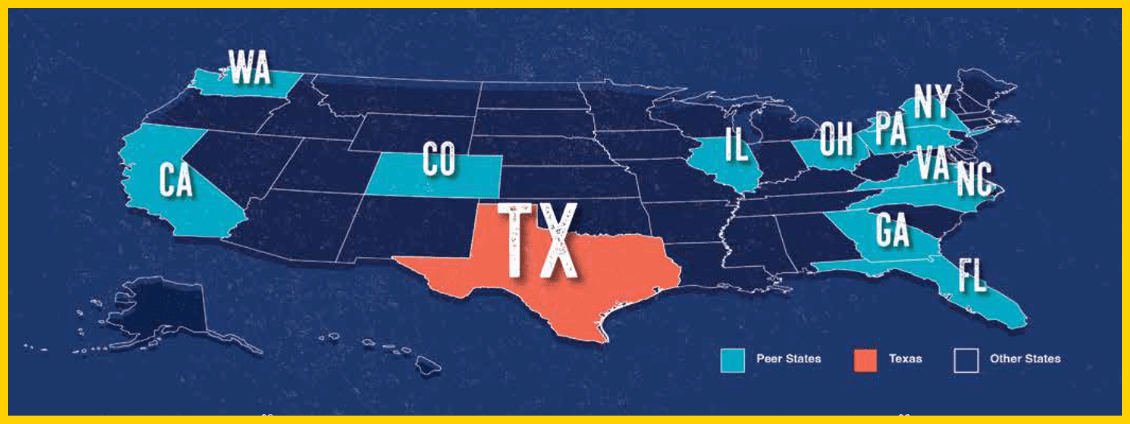
Same but Different: While it was important in our Strategic Framework to track Texas on specific metrics, we also saw a need to know how Texas is doing against similar states. To determine these states, we asked three big questions:
- Which states are our primary competitors for business?
- Which states are our primary competitors for talent?
- Which states are similar in size to Texas?
Texas’ Peers: You know California made the list. Here are the others: Colorado, Florida, Georgia, Illinois, New York, North Carolina, Ohio, Pennsylvania, Virginia and Washington.
- Metrics for these states allows Texas policymakers and the public to make some of the same comparisons that people and businesses around the world make when looking where to invest or live.
Read more: “How does Texas stack up against ‘Peer States’?“
Data Is the Currency📊
What to Know: The structure of our Strategic Framework allows all Texans to consider what it might take to ensure the long-term economic prosperity and quality of life of our state.
Learn More: To give you a glimpse of this, our team is highlighting some of the data points we find most pertinent and how they relate to our goals:
- On infrastructure … “Hot N Cold: Katy Perry and Texans’ need for affordable, reliable electricity“
- On early literacy … “Can kids in Texas read? A simple question with profound importance“
- On prosperity & well-being … “The Texas economy did well in 2021, but peer states did better“
- On workforce … “A hot jobs market, understaffed employers: What’s going on?“
- On education … “An early start to succeed in school and life: Why pre-K matters“
Interested in more of our insights? Check out our other blogs!
 Texas, it’s your turn!
What data points did you find most interesting? What would you like to see measured in the future?
Strategic Framework: The Report 📄

Shaping Our Future: While our new platform is a “living” Texas dashboard, where metrics will regularly update so you can keep track of our state’s progress, we also break down the most pressing data points in our Strategic Framework report.
- This book lays out our 36 goals, gives an overview of the influences shaping Texas and showcases the ways to use the framework, among other things.
Stay Tuned: Next, we will be rolling out a blog series of seven key findings, which will be daily highlights of some of our most current compelling data by policy areas. Don’t miss this overview!
🙏 Thank you to our financial supporters, including the generous support from the Michael and Susan Dell Foundation, for making this comprehensive resource available to all of Texas.
