
Learning loss among K-12 students as a result of the novel coronavirus pandemic is real and measurable. We will update this page with emerging data and research as we continue to learn more about the impact of the pandemic on student achievement. By collecting relevant data, we can identify solutions that remediate losses among affected populations prevent further erosion in educational achievement.
Tracking COVID Learning Loss
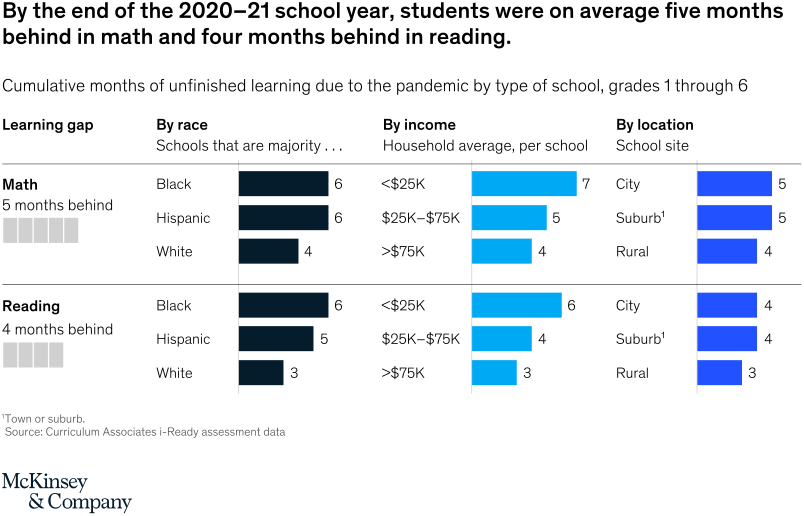
July 27, 2021 – McKinsey & Co: COVID-19 and education: The lingering effects of unfinished learning
- Students testing in 2021 were about ten points behind in math and nine points behind in reading compared with matched students in previous years.
- Unfinished learning through the pandemic exacerbates historical inequities, especially for Black students.
- Parents reported increases in mental health conditions and concerning behaviors in their children.
- Absenteeism among students in eighth through 12th grade increased significantly during the pandemic.
- The economic gap caused by pandemic-related unfinished learning adds to existing racial achievement gaps in the United States.
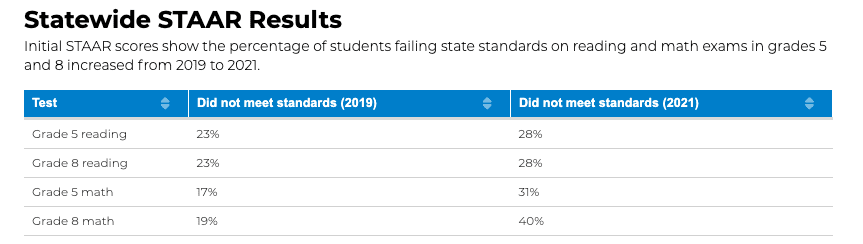
June 23, 2021 – Texas braces for bad STAAR results that are ‘every bit as problematic as we thought’
- Statewide, the percentage of fifth graders failing math standards increased from 17% to 31% while the percentage of eighth graders failing it jumped from 19% to 40%.
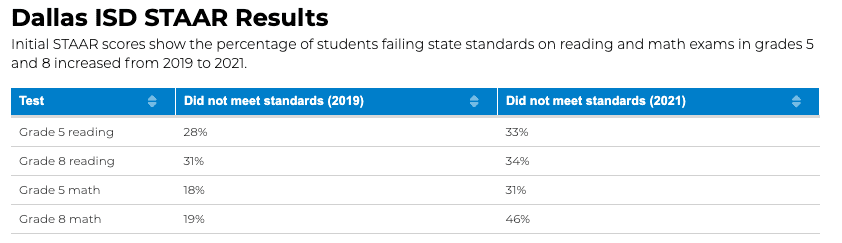
- Dallas ISD saw similar trends — 31% of fifth graders failed math standards compared to 18% in 2019 . The percent of eighth graders who didn’t pass the standards increased from 19% to 46%.
- Only 23% of DISD students met that level in fifth grade, down from 34% two years ago. The district saw 6% of eighth graders hitting that mark, down from 14%.
- The percent of DISD fifth graders who failed reading rose from 28% to 33% and the percent of eighth graders increased from 31% to 34%.
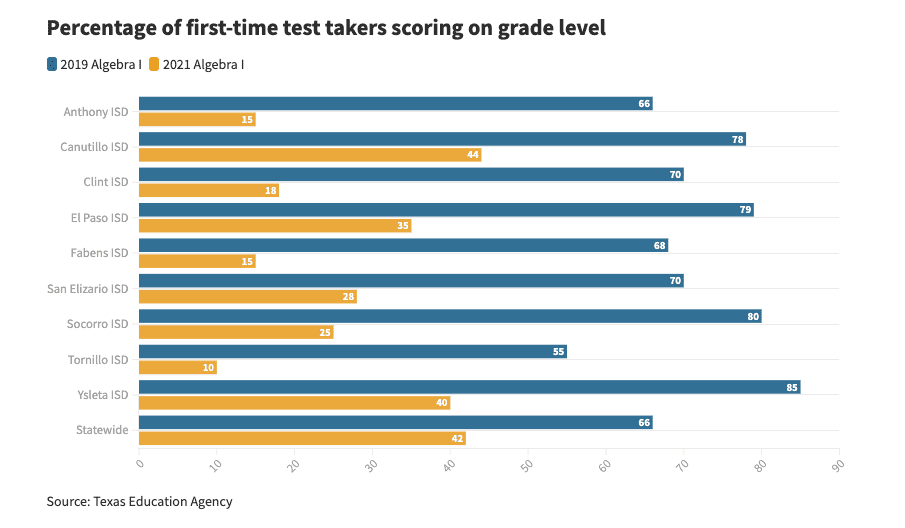
June 23, 2021 – El Paso sees sharp decline in high school math STAAR scores
El Paso area high school students performed significantly worse on this spring’s state standardized math exam, the first indication of the extent of pandemic learning loss in public education.
The percentage of first-time test takers who scored on grade level for the Algebra I end-of-course exam fell by 47 points compared to 2019, the most recent year the State of Texas Assessments of Academic Readiness were administered.
May 17, 2021 – COVID-19 School Closures: Long-run Macroeconomic effects
Penn Wharton Budget Model estimates that the learning loss from school closures reduced GDP by 3.6 percent in 2050. Extending the 2021-22 school year by one month would cost about $75 billion nationally but would limit the reduction in GDP to 3.1 percent. This smaller reduction in GDP produces a net present value gain of $1.2 trillion over the next three decades, equal to about a $16 return for each $1 invested in extending the 2021-22 school year.
January 27, 2021 – Ohio State University: The COVID-19 Pandemic and Student Achievement onOhio’s Third-Grade English Language Arts Assessment
- Average decline of achievement on the Ohio Third-Grade English Language Arts (ELA) assessment was equivalent to one-third of a year’s worth of learning.
Black students experienced test score declines that were nearly 50% larger than white students—for a total decline of approximately one-half of a year’s worth of learning.
Over 10 percent of districts (over 60 districts) experienced no test score declines during the pandemic.
Achievement declines were more pronounced among districts that began this academic year using fully remote instruction compared to districts using either hybrid instruction or in-person instruction.
January 14, 2021 – Texas Education Agency: Optional Beginning-of-Year Assessments Data Help Quantify Initial Impact of COVID-19 on Texas Students
After the cancellation of the end of school year 2019-20 State of Texas Assessments of Academic Readiness (STAAR®) tests due to the COVID-19 pandemic, the Texas Education Agency (TEA) offered optional beginning-of-year (BOY) assessments so schools across the state could measure how well students learned the prior grade-level’s knowledge and skills. With that information, schools and teachers could make adjustments to curriculum and instruction for the fall of the 2020-21 school year, adjustments that would be necessary to help maximize student learning given the disruptions caused by COVID-19 in the spring of 2020.
- Only 29% of Texas 3rd graders achieved “meets grade level” in reading
- Only 15% of Texas 4th graders achieved “meets grade level” in math
- Only 12% of Texas 5th graders achieved “meets grade level” in science
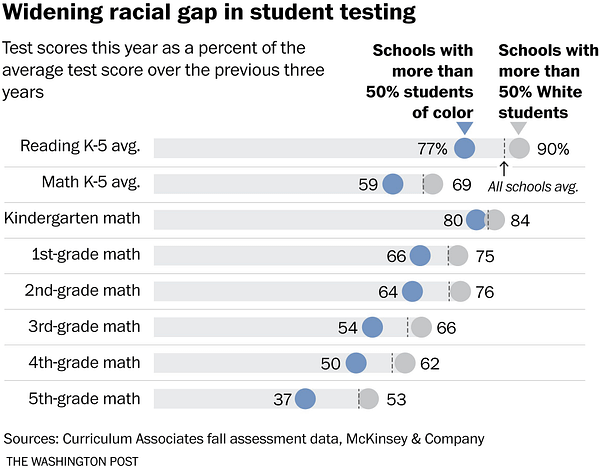
December 8, 2020 – McKinsey & Co: COVID-19 and learning loss—disparities grow and students need help
- Analyzed assessment data from the Curriculum Associates i-Ready platform and found that students in their sample learned only 67 percent of the math and 87 percent of the reading that grade-level peers would typically have learned by the fall.
- On average, that means students lost the equivalent of three months of learning in mathematics and one-and-a-half months of learning in reading.
- The learning loss was especially acute in schools that predominantly serve students of color, where scores were 59 percent of the historical average in math and 77 percent in reading.

December 6, 2020 – The Washington Post: ‘A lost generation’: Surge of research reveals students sliding backward, most vulnerable worst affected
A flood of new data — on the national, state and district levels — finds students began this academic year behind. Most of the research concludes students of color and those in high-poverty communities fell further behind their peers, exacerbating long-standing gaps in American education.
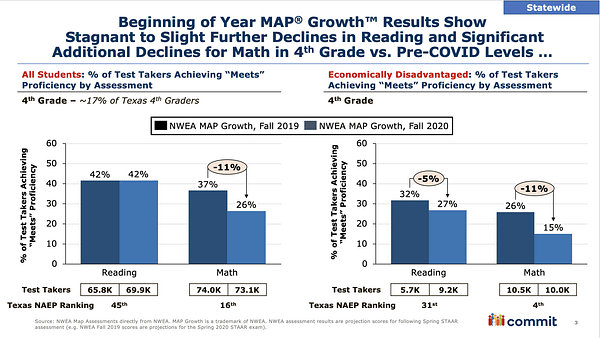
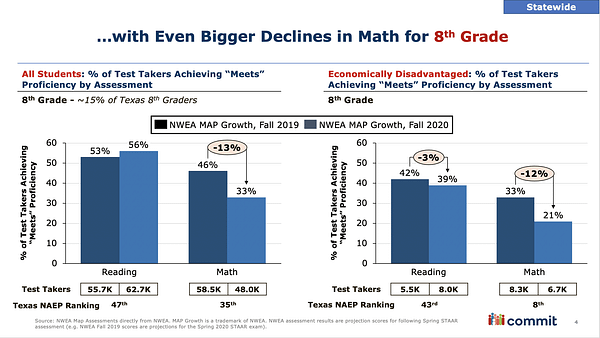
December 1, 2020 – Commit Partnership: Our Back-to-School Data, And What We Do About It
The Commit Partnership was given the opportunity to collaborate with the national assessment organization NWEA to analyze MAP Growth assessment data from the beginning of the 2019 and 2020 school years for all Texas districts they work with. Importantly, this data, while provided anonymously with respect to student and district, was disaggregated to explore the outcomes of students living within homes with limited incomes versus their more affluent peers. NWEA’s sample set is sizable, representing one sixth of all Texas students, with students who live in limited income homes being somewhat underrepresented relative to the actual percentage they represent of the state overall.
Overall, our 4th grade and 8th grade reading scores per MAP Growth remained flat to slightly up (though as a state we ranked 45th and 47th nationally in those domains in 2019 on the Nation’s Report Card, or NAEP, and therefore already had much room to improve). Math scores, where we ranked in the middle of the pack nationally in 2019 on NAEP, declined much more notably over the past twelve months.
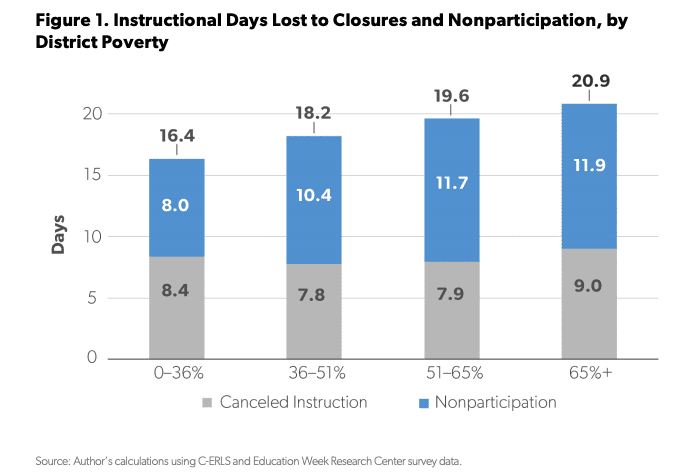
October 6, 2020 – AEI: Too little, too late: A hard look at spring 2020 remote learning
- On average, the poorest districts lost four full weeks of instruction, which is equivalent to 12 percent of a school year and 41 percent of the period between closures and the last day of school. Estimated lost instructional time due to student nonparticipation in remote learning after closures was greater than canceled instructional days.
- The quality of remote-instruction programs was lower in schools with higher student poverty and lower student achievement, as measured by multiple indicators.
- Schools had comparatively lower-quality remote-instruction offerings when in districts that had less educated adult populations, higher rates of single-parent households, and less broadband access.
October 1, 2020 – Center for Research on Education Outcomes at Stanford University: Estimates of Learning Loss in the 2019-2020 School Year
The findings on learning losses support four general inferences.
- First, the findings are chilling – if .31 std roughly equals a full year of learning, then recovery of the 2019-2020 losses could take years. Additional losses incurred in the current year further impact the timeline. The underlying variations in 2019-2020 learning losses highlight the fact that school closures had highly differentiated impacts, with disadvantaged students generally suffering much more than students from advantaged families.
- Second, the wide variation within states (and often within schools) means that conventional models of classroom-based instruction – a one-to-many, fixed pace approach — will not meet the needs of students. New approaches must be allowed to ensure high quality instruction is available in different settings, recognizing that different skills may be needed for the different channels.
- Third, the need for rigorous student-level learning assessments has never been higher. In particular, this crisis needs strong diagnostic assessments and frequent progress checks, both of which must align with historical assessment trends to plot a recovery course.
- Fourth, the measures of average loss and the range around it immediately call into question the existing practice of letting communities plot their own path forward. The communities whose schools have the largest estimated loss of learning are far less likely to have the means and capacity to create and implement recovery plans on their own. Insistence on local autonomy in this case will not yield equitable responses.
November 23, 2020 – NWEA: Learning during COVID-19: Initial findings on students’ reading and math achievement and growth
Key Findings:
- In fall of 2020, students in grades 3-8 performed similarly in reading to same-grade students in fall 2019, but about 5 to 10 percentile points lower in math.
- In almost all grades, most students made some learning gains in both reading and math since the COVID-19 pandemic started. However, gains in math were lower on average in fall 2020 than prior years, resulting in more students falling behind relative to their prior standing.
- This fall, students scored better than NWEA’s projections in reading, while math scores were in line with our projections for grades 4-6 and slightly above our projections in grades 7-8.
- Some differences by racial/ethnic groups are emerging in the fall 2020 data, but it is too early to draw definitive conclusions from these initial results. Student groups especially vulnerable to the impacts of the pandemic were more likely to be missing from our data. Thus, we have an incomplete understanding of how achievement this fall may differ across student groups and may be underestimating the impacts of COVID-19.