Project Overview

Texas 2036 has developed an online, public community college finance simulator that will allow Texas to identify how funding to two-year community colleges are allocated and what the impacts of potential changes to current policies might be. The development of this tool coincides with the convening of the state’s Commission on Community College Finance, as established by 87(R) Senate Bill 1230. 

This tool is intended to support the Texas Commission on Community College Finance, Texas community colleges, and other stakeholders in investigating policy solutions that strengthen and sustain the state’s community college finance system while highlighting the importance of students’ outcomes. With the Commission’s work culminating in a full package of reforms for the 88th Texas Legislature’s considerations, Texas 2036 has modeled the Commission’s recommendations to offer insight on potential financial impacts.

Simulator Tool Capabilities

The capabilities of the simulator include:

  • Displays that include all funding sources—state appropriations, tuition and fee revenues, and local tax dollars — for Texas community colleges in static and trend formats including statewide totals and individual institutional data. All current elements include these capabilities unless otherwise noted.
  • Modeling of the community college finance system as recommended by the Texas Commission on Community College Finance. 
  • Modeling of the existing Texas community college finance formulas —Core Operations, Success Points and Contact Hours.

Navigating the Tool

The simulator allows users to create simulations using two different models for our state’s community college finance system. Both models have the same data displays and many of the same functionalities, albeit with some important differences. This guide will first focus on the elements of the simulator that are consistent across all three models, before discussing each model’s key differences and their uses below. 

State Budget Information

At the top of the simulator tool page, you can see the “bottom line,” or how any adjustments made to the state’s funding formula impacts the state budget for FY 2022. 

  • State Budget: The first figure (set to $916,653,595 by default), is the total annual amount of state funding provided to community colleges. 
    • Users can adjust the budget up and down by whole percentages by clicking the up and down arrows to the right of the state budget amount. Users can see how increasing or decreasing this amount impacts the state deficit or surplus.
  • Formula Cost: After making modifications to the formula, users can see the impact on the overall cost of the state funding formula in the middle figure (more information is below on how to make these adjustments and see their impacts). 
  • Deficit/Surplus: On the right, users can see how adjustments to the various components of the funding formula compare to the set state budget amount.

Formula Inputs

The formula inputs include the primary ways a user can modify community college funding appropriated by the state. Each model contains different inputs, which are explained in each model’s description.

  • Proposed Formula System Description
  • Current Formula System Description

Formula Output Visualizations

After adjustments are made to the Formula Inputs, users can see how that impacts individual college districts, and compare across districts, using three visualizations in the middle of the simulator tool: a scatterplot, map, and pie chart. 

Users can delete figures by clicking the three dots () in the upper right corner of the visualization they wish to delete. Click “Delete Figure” to remove the visualization from the screen. Users can customize the visualizations they would like on the screen by clicking on the plus sign button to create a new figure. Click this button to add another data visualization. Select “Statewide” to add a scatterplot, bar graph, or map, or “District” to add a pie chart or stacked bar chart graphic.

On devices with smaller screens, such as tablets, users may only see a scatterplot and map, with a plus sign button on the right to create a new figure. Click this button to add a third data visualization, and follow the same steps for customizing the visualizations on the screen. 

Scatterplot
  • The scatterplot graph allows users to show the relationship across college districts between two data sets in the tool, with an array of data from which to choose, including different sources of revenue, enrollment, and different components of the state funding formula.
  • Click the three dots () in the upper right corner of the visualization to choose variables to show on both the x- and y-axes, categorize the districts by size and region, and have the size of the bubbles on the graph align with district size. 
  • Mouse over the bubbles to see the corresponding name of the district and its data for each of the selected axes.

Map
  • The map visualization allows users to see the same indicators/variables as the scatterplot, reflected so that each college district’s location in Texas is aligned with their service area. 
  • Click the three dots () in the upper right corner of the visualization to choose variables to be reflected for each college district relative to where their service area is located in Texas, choose the desired scale (Quantiles = Equal number of districts assigned to each grouping; Quantize = Equal data intervals between minimum and maximum data points), and select the number of divisions for the selected scale.
  • Mouse over each college district to see the corresponding name of the district and its data for the selected variable.

Pie Chart
  • The pie chart shows the amounts of revenue at individual college districts for each component of the “three-legged stool” for revenue: state funding, tuition and fees, and ad valorem taxes.  
  • Click the three dots () in the upper right corner of the visualization to choose individual districts to view and switch between projected revenue and FY 2022 revenue.

Bar Graph
  • The bar graph visualization allows users to see the same indicators/variables for each campus as the scatterplot, where the height of the bar correlates to the variable selected for the y-axis, and the data sorts by the variable selected for the x-axis.  
  • Click the three dots () in the upper right corner of the visualization to choose variables to show on both the x- and y-axes and categorize the districts by size and region.
  • Mouse over the bars to see the corresponding name of the district and its data for each of the selected axes.

Stacked Bar Chart
  • The stacked bar chart visualization allows users to see an individual college district’s property tax information compared to state averages. Available variables include district tax rates and total property tax revenues. Both the rates and revenues are separated into the two types of property taxes that can be levied by a community college district: Maintenance & Operations, which pays for operating costs, and Interesting & Sinking, which pays for capital costs.
  • Click the three dots () in the upper right corner of the visualization to choose which variable to represent on the stacked bar charts.
  • The user has the ability to include information on each community college district’s “cap space”, which compares a district’s current tax rate or property tax revenues compared to the maximum tax rate, or cap, that a district is statutorily authorized to adopt.

Data Table

At the bottom of the simulator tool page, users can clearly see both how the current funding formula as well as any modifications impact individual schools according to all indicators available in the tool using the data table at the bottom. 

Users can select and group which indicators they would like to review by selecting them in the dropdown box, and then deselecting them by clicking the “x” next to each indicator in the dropdown box. Users can see the indicators for individual districts by selecting them in the “Filter By District” dropdown, and then deselecting them by clicking the “x” next to each district’s name in the dropdown box. Indicators available in the data table mirror those available to view in the visualizations above.

Download and Additional Resources

At the top of the screen, there are three buttons for users to access and download resources related to the tool:

  • The Question Mark Icon opens the tool’s walkthrough.. 
  • The Filing Folder Icon points users to links to all publicly available data sources used in the tool.
  • The Information Icon provides a brief set of user instructions for navigating the tool. 
  • The Export CSV option allows users to download the data as currently seen on the tool for each college district in a .csv file format. In other words, any modifications made to the formula will appear for each district in the downloaded data

Current Formula Description

The Current Formula model represents what the Texas legislature uses presently to distribute state funds to community colleges. The funding is divided into three main segments:

Contact Hour funding is designed to aid each district based on the relative cost of providing educational services. Classes are divided across 26 different educational disciplines, and a cost study is conducted each biennium to determine the median cost of one “contact hour” in each discipline. The number of contact hours are counted for each school and then multiplied by the relevant average cost. The legislature does not fund the entire amount because the cost study is inclusive of all funding, including tuition and tax revenue. Instead, it sets the state’s portion using a rate that serves as a percentage of the total cost, based on available funds.

Success Points funding functions as an incentive to schools to emphasize movement toward certain metrics of student success. Examples include graduating students in critical fields, success in developmental education, and transfers to four-year institutions.  There are currently a total of 11 student success metrics. A weight is given to each success metric, based on the state’s priorities.  In the current formula model, only the weights applied to each success metric can be modified. Modifications to the weights for each success point metric allows for simulations where available funding is reallocated to each community college based on their existing levels of student success. This is because the Success Points formula is based on available funds. The Success Points Rate determines the amount allocated to each school based on their count of success points. That rate changes automatically when weights of success metrics are changed to ensure that allocations stay within available funds.

Core Operations funding is intended to help each college cover basic operating costs in addition to the instruction and administration costs covered by the Contact Hours formula. The state does not account for a district’s characteristics, such as a district’s geographic location or size, to determine the amount of Core Operations funding for each district. Instead, the state sets a flat dollar amount, which is usually around $1 million per district for a biennium, to ensure an equal distribution for each district. 

Current Formula Inputs

In the Current Formula model, the primary way to make modifications to community college funding is by modifying the three components of the state’s existing funding formula: Contact Hours, Success Points, and Core Funding.

  • Success Points: Users are able to adjust the weight for each of the 11 individual Success Point metrics.
    • More information about Success Points is available here
  • Contact Hours: The overall contact hours accumulated by community colleges are funded at varying percentages measured against total costs for those contact hours. Users can adjust this percentage, which is set at .2019 (20.19%) by default.
    • More information about Contact Hours is available here.
  • Core Funding: The Texas Legislature provides all 50 campuses with a flat dollar appropriation through the Core Funding formula. Users can adjust this amount, which is set at $680,406 by default.

Click the “Reset”  to revert any modifications back to the defaults. 

Proposed Formula Description

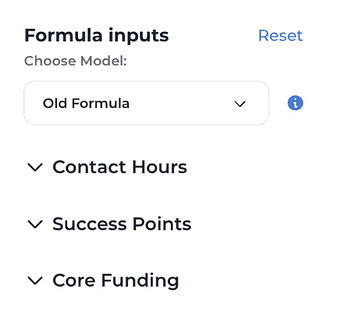
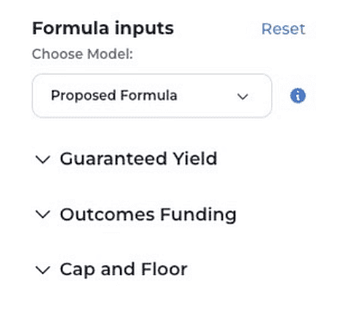
The Proposed Formula model is fundamentally different from the Current Formula model. The Current Formula model allocates funding based on state priorities and available funds without adjustments for a district’s own revenue-raising capacity. The Proposed Formula model first estimates districts’ operating need, provides users with the option to subtract from that need based on a district’s taxing capacity and tuition and fee estimates to determine state aid for operating costs, and then adds outcomes-based funding.

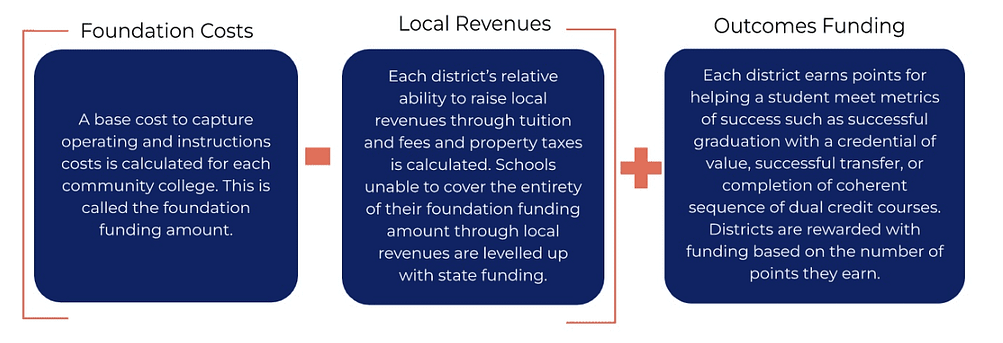
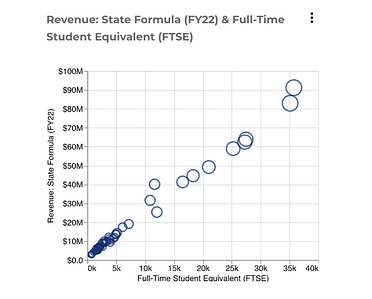
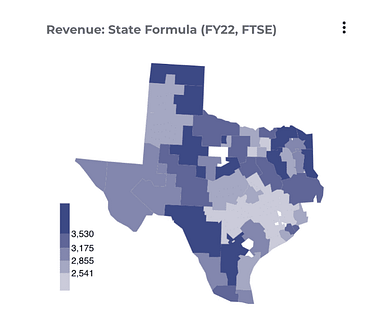
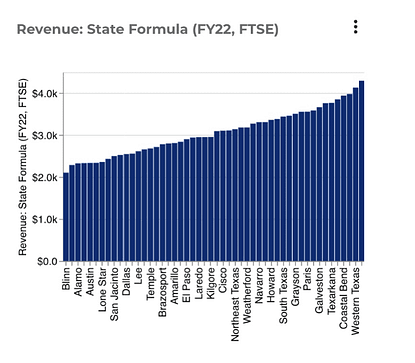
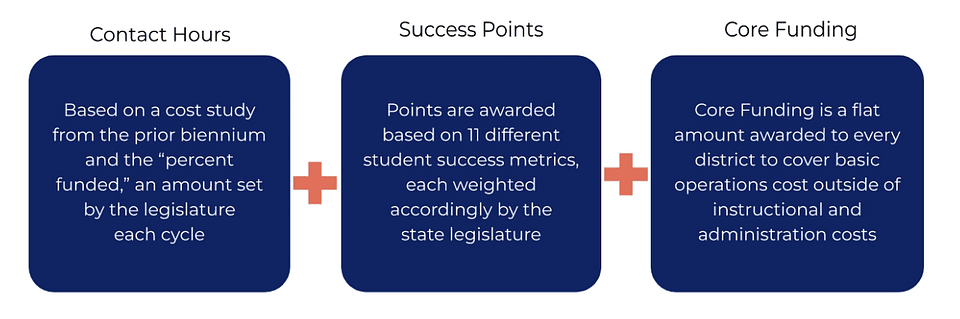
The Guaranteed Yield first estimates the total funding necessary, regardless of revenue source, to meet a district’s instructional and operating costs. This is their Foundation Funding amount. The calculation begins with the annual cost study administered by the Texas Higher Education Coordinating Board (THECB) and adapted for the Contact Hours formula. Users have the option to determine what percentage of the total instructional and operating costs should be factored into the state’s formulas. Next, a per-student dollar amount is set for the Basic Allotment that will be multiplied by each Full-Time Student Equivalent (FTSE) served by a college district. Demographic weights are then applied to a district’s FTSE count to estimate the additional costs associated with educating students with additional needs. These students are identified as academically or economically disadvantaged or as adult learners. Academic Disadvantage is defined as the percentage of students identified as not being college ready in reading, writing, or math, based on students’ scores measured by the Texas Success Initiative Assessment. Economic Disadvantage is defined as the percentage of students receiving a federal Pell Grant. Adult learners are students who are at least 25 years old. There is also a Small Schools weight to account for diseconomies of scale among college districts who serve fewer students relative to other districts. Once the percentage is set for Contact Hours, and all demographic and institutional weights are applied to college districts’ FTSE counts, the totals are added together. The sum is a full estimate of district operating needs. This will be the base used to identify the state’s portion of funding for operations costs.

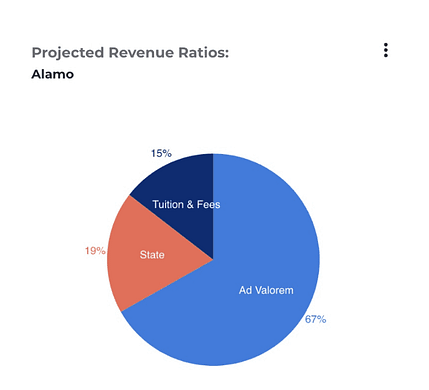
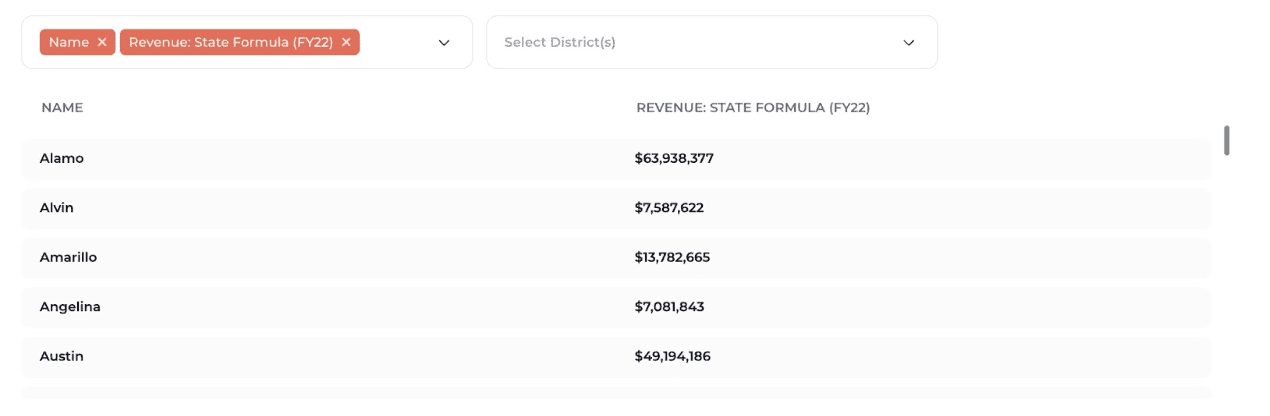
Revenues from Ad Valorem (Property) Taxes and Tuition and Fees are components of a district’s potential estimated Deductions. This is the amount of money that a district is estimated to be able to provide for its own operations costs. The Deductions are subtracted from the base Foundation Funding amount because it includes operating costs that are being paid for by other revenue sources, including Property Tax and Tuition revenues, in addition to state funding. 

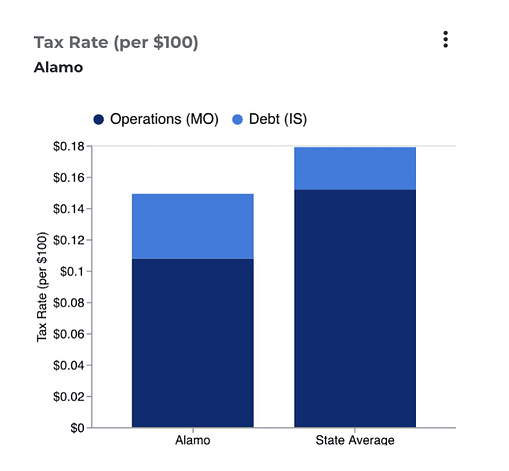
Districts are restricted from raising more than $1 per $100 in taxable property within a given district (Texas Education Code, Sec. 130.122), and no district is raising more than $0.40 based on the most recently available data. For the Ad Valorem Deduction, the user can set a contribution percentage, which is a proportion of the total tax rate allowed by state law. The tool is meant to simulate changes only to state policies, not local policies. As such, users will be limited from raising the contribution percentage higher than $0.05 to limit simulations only to those that would not force local decisions on property tax rates. To adjust the Tuition and Fee Deduction, users set a dollar amount that is multiplied by the number of FTSEs served in a district. The Ad Valorem and Tuition and Fee Deductions are then added together to determine a district’s total Deductions amount.

A district’s Guaranteed Yield appropriation is calculated by subtracting their total Deductions amount from their Foundation funding levels. The difference equals the district’s Guaranteed Yield appropriation. However, it is important to note that it is possible for a district to have a Deductions amount greater than their Foundation Funding amount, depending on how a user chooses to simulate the Deductions. This aligns with the Commission’s recommendation that the Guaranteed Yield only be provided to districts with low taxable valuations to address diseconomies of scale between districts. 

Outcomes Funding is added on top of a district’s Guaranteed Yield. The outcomes metrics align with the Commission’s final recommendations: credential of value graduates, credentials of value awarded in a high-demand field, successful transfer up to a four-year university, and completion of a sequence of dual credit courses applicable to collegiate-level academic and workforce program requirements. For each student who produces these outcomes, districts earn points based on the weights applied to each metric. Districts can also earn additional points if the student earning the point(s) is Economically or Academically Disadvantaged or is an Adult Learner. A district’s Outcomes Funding amount is determined by multiplying the total points the district earns by a dollar amount set by the state. 

The Commission also recognized the potential need to help districts smoothly transition to the new finance system to ensure funding stability for themselves and their students. Cap and Floor functions are meant to simulate options to this effect. The Hold Harmless option allows users to set a guaranteed minimum level of funding for districts based on a percentage of their state funding levels in Fiscal Year 2022. Similarly, the Gains Cap option allows users to set a maximum level of funding that districts can receive under the new formula based on a percentage of their state funding levels in Fiscal Year 2022. 

Proposed Formula Inputs

The default settings for the Proposed Formula model makes adjustments to meet two criteria: (1) ensure that the majority of state funding is captured in Outcomes Funding, in line with the Commission’s recommendations, and (2) provide a bottom-line cost to the state of approximately $214 million per fiscal year, in line with the initial investments from the State Legislature in their proposed budgets (House Bill 1 and Senate Bill 1) to enact community college finance reform for the 2024-2025 biennium.

Guaranteed Yield

For the Guaranteed Yield Formula, the user must first set Foundation funding levels.

  • Contact Hours Rate: This is based on the annual cost study conducted by the state based on community colleges’ reported annual instructional and operations costs. The full amount, or 100%, is representative of the total costs reported to the state. Users can adjust the percentage to determine how much of those total costs will be factored into state formulas.
  • Basic Allotment: Users can input a dollar amount for the Basic Allotment, which will be multiplied by the number of Full-Time Student Equivalents (FTSE) served by a district. 
  • Student Population Weights: Users can set a weight for each of the three disadvantaged student populations identified by the Commission – Economic Disadvantage, Academic Disadvantage, and Adult Learners. The weight serves as a multiplier for a district’s FTSE count. For example, if a district serves 100 FTSEs, and 10% (or 10) of those FTSEs are Economically Disadvantaged, a weight of 0.1 for Economic Disadvantaged would lead to a 10% increase for those 10 Economically Disadvantaged FTSEs. This translates to 1 additional FTSE, making the district’s final FTSE count equal to 101 FTSEs. 
  • Small Schools Weight: Users can also set a weight for small schools who may need additional resources to address economies of scale. To calculate this, users must first set a Small Schools Threshold based on FTSE, then the difference between the threshold and a school’s actual FTSE count is multiplied by the weight, the product of which is added on as additional FTSEs for the district, similar to the Student Population Weights. For example, for a district with 4,900 FTSEs, a threshold of 5,000 would mean that 100 FTSEs will benefit from the Small Schools Weight. A weight of 0.1 would be a 10% increase for those 100 FTSEs. This translates to 10 additional FTSEs, making the district’s final FTSE count equal to 4,910 FTSEs.

Once the Foundation funding levels are set, the user must then establish the required Deductions to ensure that only districts with low taxable valuations are served by the Guaranteed Yield formula, in line with the Commission’s recommendations. 

  • Ad Valorem (Property Tax) Deduction: Users can set an amount depicted in cents to calculate how much property tax effort will be factored into the Guaranteed Yield Formula. This is because state law limits the total community college tax rate at $1.00 per $100 in taxable property valuations. The amount in cents chosen by a user is equivalent to a rate that is used to multiply against districts’ maximum taxable property valuations.
  • Tuition and Fee Deduction: Users can set a dollar amount that will represent the amount of tuition and fees charged to a single FTSE. The dollar amount is multiplied against each district’s base FTSE count, so any additional FTSEs earned by a district due to the Disadvantaged Population Weights and the Small Schools Weight are not used to calculate the Tuition and Fee Deduction.
Outcomes Funding

For the Outcomes Funding Formula, users must first set an amount in the Dollars Per Point box that will represent the state’s rate against which the total number of points earned by a district will be multiplied.

Student outcomes are based on historical data. However, users can also use the Relative Expected Performance to simulate uniform increases or decreases in student outcomes. For example, setting the slider at +25% translates to an across-the-board 25% increase for all of the student outcomes data selected by users.

Historical data for student outcomes spans Fiscal Years (FY) 2019, 2020, and 2021. Users can select how many years of data they want to use in the Number of Years to Include dropdown box. Selecting multiple numbers of years will result in averages being used for student outcomes. For example, if the user selects Three Years, then all student outcomes data from FY 2019, 2020, and 2021 will be added together and divided by three to get the three-year average. 

Users must also choose how to measure student outcomes.

  • Graduation: This metric measures credential of value completion. In the Measurement Type box, users can select to count either the Number of  Graduates or Number of Credentials. Number of Graduates counts students, meaning that if a student graduates with multiple credentials in a given year, that student will only count once. If selecting the Number of Graduates option, users must set a Graduates Weight. This will calculate how many points a single graduate can earn. For example, a weight of 1.25 translates to 1.25 points for a single graduate. Number of Credentials counts credentials, meaning that every single credential conferred by a district will each count once. If selecting the Number of Credentials option, users must set a weight for each type of credential to calculate how  many points each credential is worth. For example, if a student graduates with an associates degree and a Level 3 certificate, an Associates Weight of 2.25 and a Level 3 Certificate Weight of 0.5 translates to 2.75 total points earned by that student.
  • Targeted Graduation: This metric measures credential of value completion in a high-demand field. High-demand fields are defined using the Targeted Fields methodology recommended by the THECB Community and Technical College Formula Advisory Committee’s Formula Funding Recommendations for the 2024-2025 Biennium. This metric only counts the graduates or credentials in the identified Targeted Fields, meaning there is no duplication between the Graduation and Targeted Graduation metrics. Similar to the Graduation metric, users must choose to either count the Number of Graduates or Number of Credentials and then designate weights accordingly.
  • Transfer: This metric measures the number of students earning credits at a community college who are found subsequently enrolled in a four-year university for the first time. Users must first choose between 15 and 30 Hours as the number of semester credit hours a student must earn at a community college prior to enrolling at a university to qualify as a successful transfer. Users must then designate a Transfer Weight, which functions the same as the weights in the Graduation and Targeted Graduation metrics. 
  • Dual Credit: This metric measures the number of students completing a coherent sequence of dual credit courses that meet academic or workforce program requirements. Data is limited with workforce program requirements as there is not yet an existing matrix that matches dual credit courses to the requirements of the diverse and unique workforce programs offered by community colleges. As a result, this metric only measures dual credit courses that are applicable to academic program requirements. This is defined by the core curriculum. However, each community college has the ability to define their own core curriculum. All core curricula are listed in the Texas General Education Core Curriculum WebCenter.  To accommodate variety between core curricula, users must choose to reward dual credit courses that match with “Any” or “All” core curricula. The “Any” option recognizes every course that is listed in the core curriculum of any community college as a core curriculum course – even if some of those courses are only recognized as such by a single college. The “All” option recognizes only those courses that are listed in the core curriculum across all community colleges. Users must then choose between 12 or 15 Hours as the number of semester credit hours a dual credit student must earn to be awarded a point. Lastly, users must designate a weight for the metric, which again functions the same as the weights in the other metrics above.

The Commission recommended that disadvantaged students who meet the outcomes metrics be awarded additional funding for their success. As such, users can set weights for Economically Disadvantaged, Academically Disadvantaged, and Adult Learners populations. Unlike the Guaranteed Yield Formula, which factors in the total percentage of disadvantaged student populations served to provide additional FTSEs, the Outcomes Funding Formula is based on individual student achievement. This means that only those disadvantaged students who actually meet the outcomes metrics above will be counted, ensuring that community colleges are rewarded for leading individual students to success. 

Data Note:

The majority of community college districts reported small numbers  of Economically and Academically Disadvantaged students and Adult Learners who met the Dual Credit outcomes metrics. In order to ensure privacy and protect sensitive information, data for these disadvantaged population outcomes were anonymized. As such, data limitations prevent this model from applying the Student Population Weights function for the disadvantaged populations.

Cap and Floor

Given that the Commission recommends an overhaul of the community college finance system and its formulas, they recognized the potential need among districts for aid with the transition to ensure funding stability for themselves and their students. As such, the model attempts to simulate transition funding mechanisms to that effect.

  • Hold Harmless: The Hold Harmless option simulates how much the transition to the new formula system will allow individual district’s state funding levels to change relative to the amount of state funds they received in FY 2022. Users can set a percentage up to 100%. As an example, for a district that received $1,000,000 in state aid in FY 2022, setting the Hold Harmless slider 25% requires that the district receive at least $250,000 in state funding.
  • Gains Cap: The Gains Cap option simulates limits on how much state funding a district might receive in addition to their state funding levels in FY 2022. Users can set a cap up to 100%, which is equivalent to receiving double the amount of funding the district received in FY 2022. As an example, for a district that received $1,000,000 in state aid in FY 2022, a 40% gains cap would mean that the district cannot receive more than $1,400,000 in state aid under the new formula.
keyboard_arrow_up